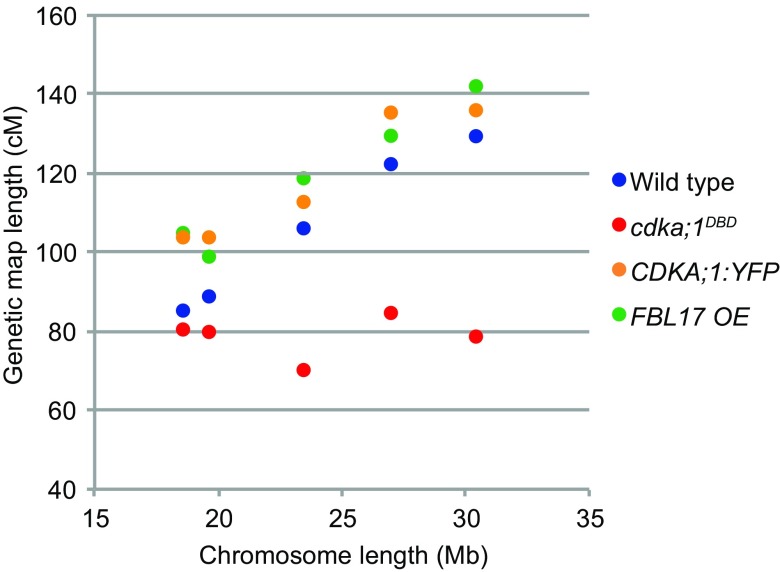
Fig. 4.
Genetic map length as a function of chromosome length for wild type, cdka;1DBD, CDKA;1:YFP, and FBL17 OE. Physical chromosome length (in Mb) is shown on the x axis, ordering chromosomes from left to right from the smallest chromosome 4 (18.8 Mb) through chromosomes 2, 3, and 5 to the largest chromosome 1 (right, 30 Mb). Corresponding genetic map lengths are on the y axis. Wild type shows a strong correlation between physical and genetic map length, which in cdka;1DBD is absent. In CDKA;1:YFP and FBL17 OE the correlation is strong, and map lengths are longer than wild type.

