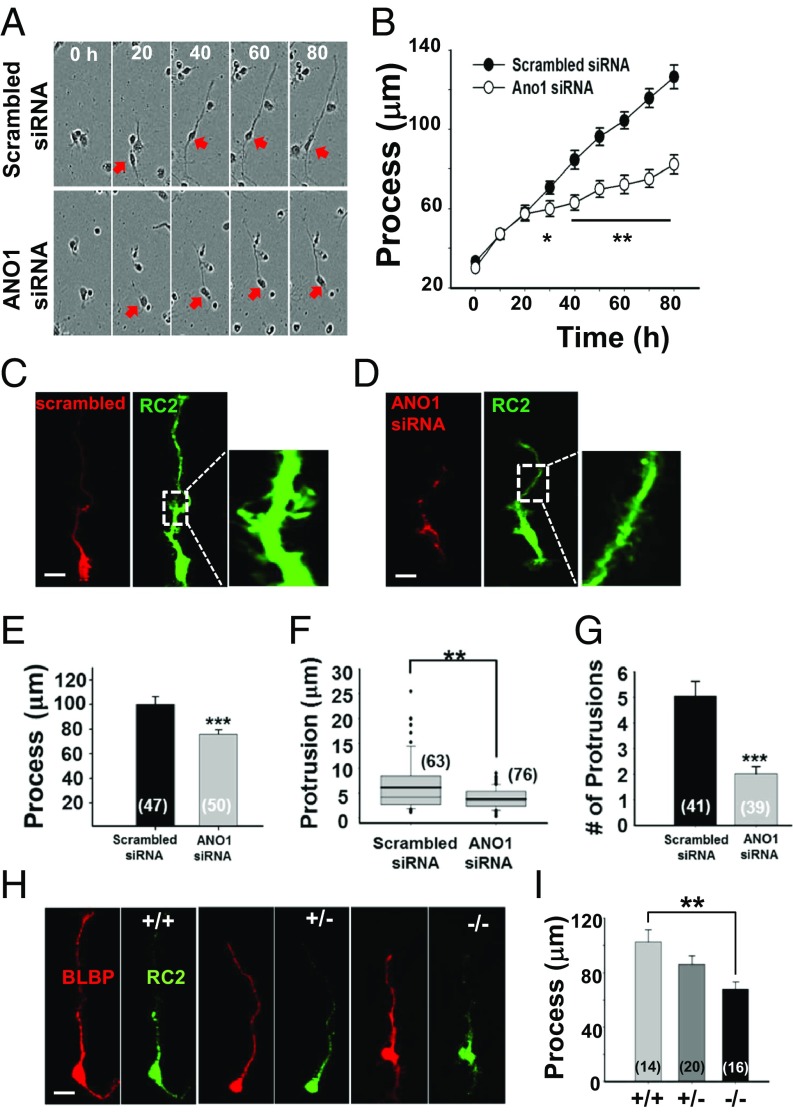
Fig. 2.
Inhibition of the RGC process extension by Ano1 disruption. (A) The length of RGC processes was monitored in a time-lapse imaging chamber. RGCs transfected with scrambled or Ano1 siRNA were cultured for 80 h. Representative images show cultured RGCs with process extension at given time points. Cell somas are marked with red arrows. (B) Summary of the length of RGC processes at given time points. *P < 0.05, **P < 0.01, Student’s t test (n = 20). (C and D) Representative images of processes of cultured RGCs. RGCs were transfected with Cy3-tagged scrambled siRNA (C) or Ano1 siRNA (D). RGCs were also stained with RC2 (green) antibody for better visualization of their processes. (Right) Expanded region of the white dashed lines. (Scale bar: 20 μm.) (E–G) Summary of the process length (E), protrusion length (F), and number of protrusions (G) per 50 μm. All experiments were validated from three to five independent cultures. Numbers in the bracket represent the number of processes or protrusions analyzed. ***P < 0.001, Student’s t test. (H) Representative images of RGCs isolated from cortices of Ano1+/+, Ano1+/−, and Ano1−/− mice at E12.5. Isolated cells were immunostained with BLBP and RC2. (Scale bar: 20 μm.) (I) Summary of the process lengths of BLBP+ and RC2+ cells isolated from each genotype. **P < 0.01, one-way ANOVA and Tukey’s post hoc test.

