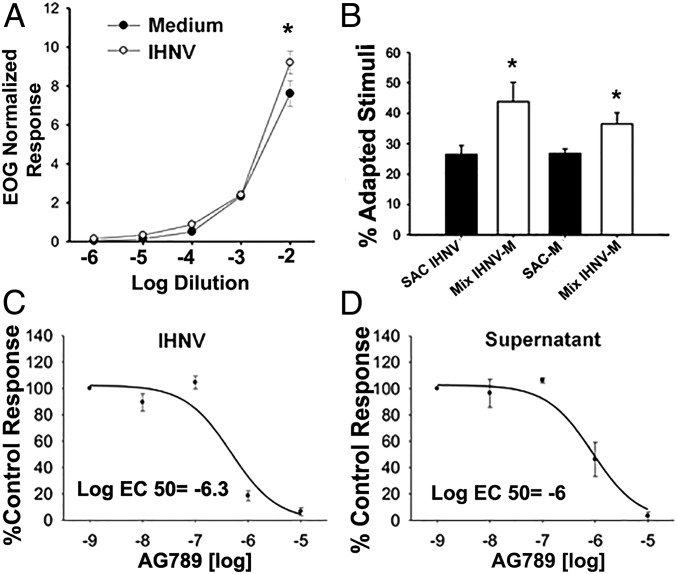
Fig. 2.
Rainbow trout smell neurotropic virus. (A) Olfactory responses to IHNV and medium where the virus was grown (negative control) produce different dose–response curves in rainbow trout measured by electroolfactogram (EOG). Responses were normalized to the l-Serine control. Data are represented as the mean ± SEM (n = 8 fish, two independent experiments). Paired t test showed significant differences (asterisk) at dilution 1:100 (P < 0.05). (B) IHNV activates a set of receptors different from those activated by virus-free medium (negative control). Cross-adaptation experiments compared olfactory responses to IHNV [self-adapted control (SAC)] or a mix of virus and the virus-free medium (Mix IHNV-M) when the OO was saturated with IHNV (adapted stimuli) odors. The same experiments were performed using the IHNV culture medium as adapted stimuli. Paired t test showed significant differences (P < 0.05) between both SAC and Mix (n = 9, one experiment). (C) AG879 treatment results in stronger inhibition of olfactory responses in IHNV than in virus-free supernatant (n = 4, one experiment). (D) Total pharmacological inhibition of olfactory responses was achieved at concentrations of the drug >10−5 M. Paired t test showed significant differences (P < 0.05) between EC50 (n = 9, one experiment).

