Fig. 6.
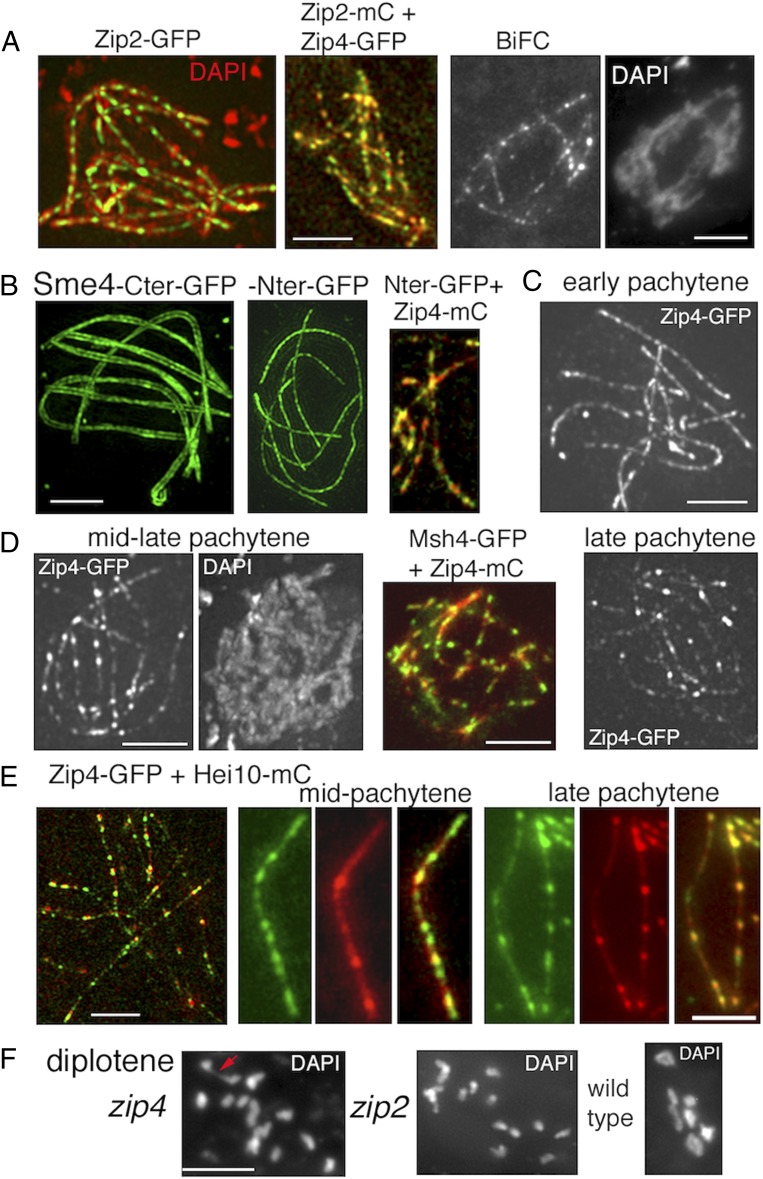
Pachytene localization of Zip2-Zip4 versus Sme4/Zip1 and Hei10. (A) All nuclei are at Pachytene. (A, Left) Costaining of Zip2-GFP with DAPI (red). (A, Middle) Colocalization of Zip2-mCherry and Zip4-GFP. (A, Right) Reconstitution of a single GFP signal by Zip2-Zip4 BiFC analysis. (B) 3D-SIM pictures of Sme4 C terminus–GFP define two lines (Left), while the N terminus–GFP is seen as a single line (second picture from left). (B, Middle) Colocalization of Sme4 N terminus–GFP with Zip4-mCherry. (C) Early pachytene nucleus with regularly spaced Zip4 foci (as Zip2 foci in A). (D) During mid-late pachytene, some Zip4 foci increase in volume and brightness (Left, compare with C). They colocalize with Msh4 foci (Middle). (D, Right) At late pachytene, the nonbright Zip4 foci are even more dim. (E) Costaining of Zip4-GFP and Hei10-mCherry during mid and late pachytene. (E, Left) 3D-SIM picture of a late pachytene nucleus. (E, Middle and Right) Foci along one homolog. At mid-pachytene (Middle), Zip4 foci (green) are more numerous and thus only partially colocalize with Hei10 foci (red), while at late pachytene (Right), the two types of foci colocalize mostly. (F) Diplotene nuclei. (F, Left) zip4 with 1 chiasma (red arrow) and zip2 with 14 univalents (Middle) versus WT nucleus with 7 chiasmate bivalents (Right). (Scale bars: 2 μm.)

