Fig. 2.
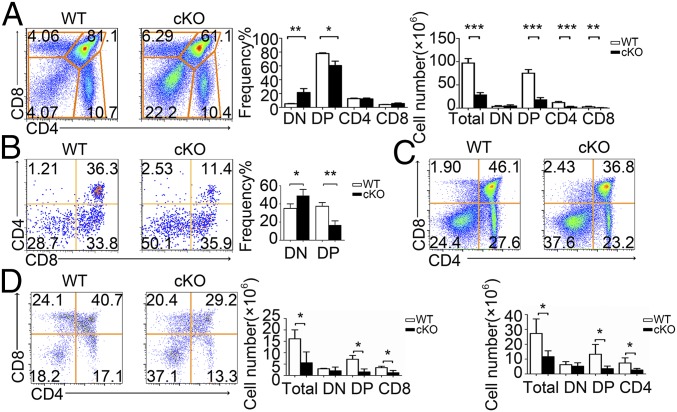
Defective T cell development in PP2Ac cKO mice. (A) Cell surface staining of CD4 and CD8 (Left) on WT and PP2Ac cKO thymocytes. Numbers in or adjacent to outlined areas (or in quadrants) indicate percentage. Bar charts indicate the frequency and cell numbers for total thymocytes DN, DP, CD4+, or CD8+ SP thymocyte subpopulations. (B) Representative flow cytometry analysis of CD4 versus CD8 in total thymocyte, and from thymocytes cocultured with OP9-DL1 cells at day 5. Percentages are indicated in the quadrants. Bar chart indicates the frequency of DN and DP. (C and D) Flow cytometry of thymocytes from WT or cKO mice expressing a transgene encoding the MHC class II-restricted OT-II (C) and OT-I (D) TCR. Bar charts indicate the cell number of different subpopulations. *P < 0.05; **P < 0.01; ***P < 0.001.

