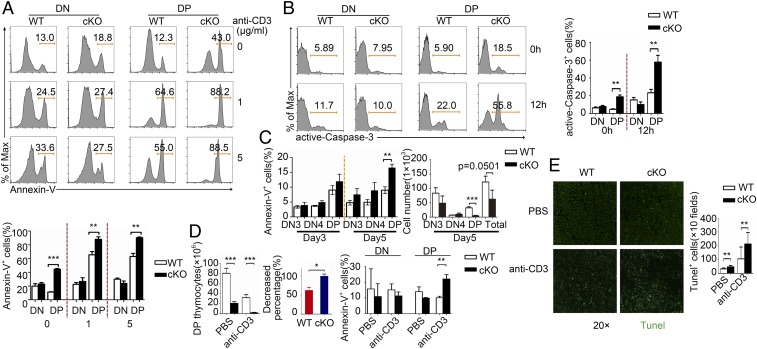
Fig. 4.
Impaired cell survival of PP2Ac cKO thymocytes. (A) Cells were gated on a single cell by the exclusion of dead cells for analysis: Annexin V staining of DN and DP cells left unstimulated or stimulated for 12 h in vitro with different doses of anti-CD3; bar chart shows quantification of the results (Lower). Data are representative of five experiments. (B) Active Caspase-3 staining of DN and DP cells left unstimulated or stimulated for 12 h in vitro with anti-CD3 bar chart shows quantification of the results. (C) Percentages and cell numbers of annexin V staining of DN3, DN4, DN, and DP cells after coculture with OP9-DL1 at day 5. (D) Number of DP cells (Left) and percentage of WT and cKO DP cells (Center) after i.p. injected with PBS or anti-CD3 for 12 h. Percentages and quantification of annexin V+ of DN and DP cells (Right). (E) Staining of total thymus with TUNEL (Green) in frozen sections from WT and cKO mice i.p. injected with PBS or anti-CD3 for 12 h and quantification of total TUNEL+ thymocytes. *P < 0.05; **P < 0.01; ***P < 0.001.

