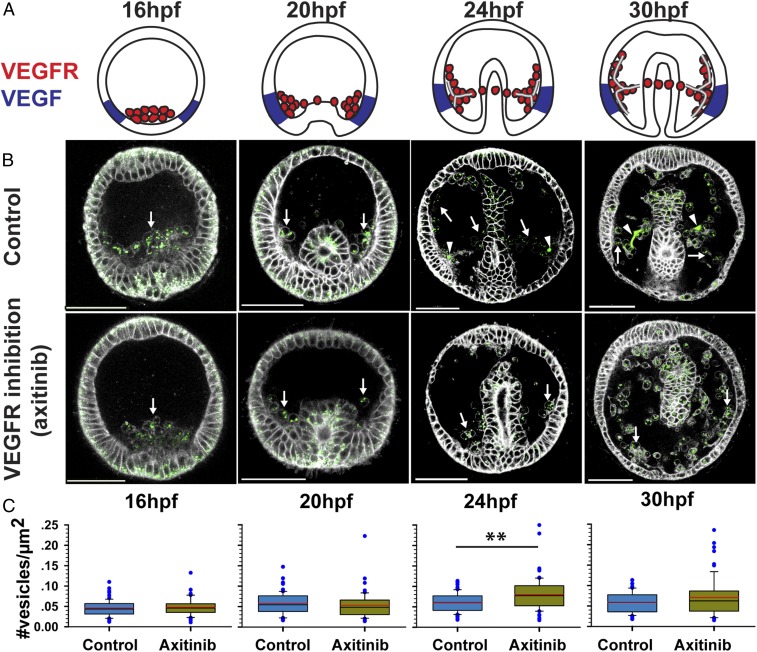
Fig. 3.
Possible role of VEGF signaling in calcium vesicle secretion. (A) Schematic diagrams showing Pl-VEGFR expression in the skeletogenic cells (red) and Pl-VEGF ectodermal expression (blue) at different developmental times (similar times in A–C). Image courtesy of Yarden Ben-Tabou de-Leon (artist). (B) confocal images of calcein staining (green) and FM4-64 membrane marker (white) show the presence of calcium vesicles in the SM cells (white arrows) in normal and VEGFR inhibited embryos (axitinib). Arrowheads indicate the spicules in control embryos. (Scale bars, 50 µm.) (C) Vesicle number per square micrometer in the SM cells in control and VEGFR inhibition. Each box plot shows the median (black line), average (red line) of the first and the third quartiles (edges of boxes) and outliers (n = 3, exact number of cells in each condition is provided in SI Appendix, Table S1). **P = 0.001.

