
FIGURE 2:
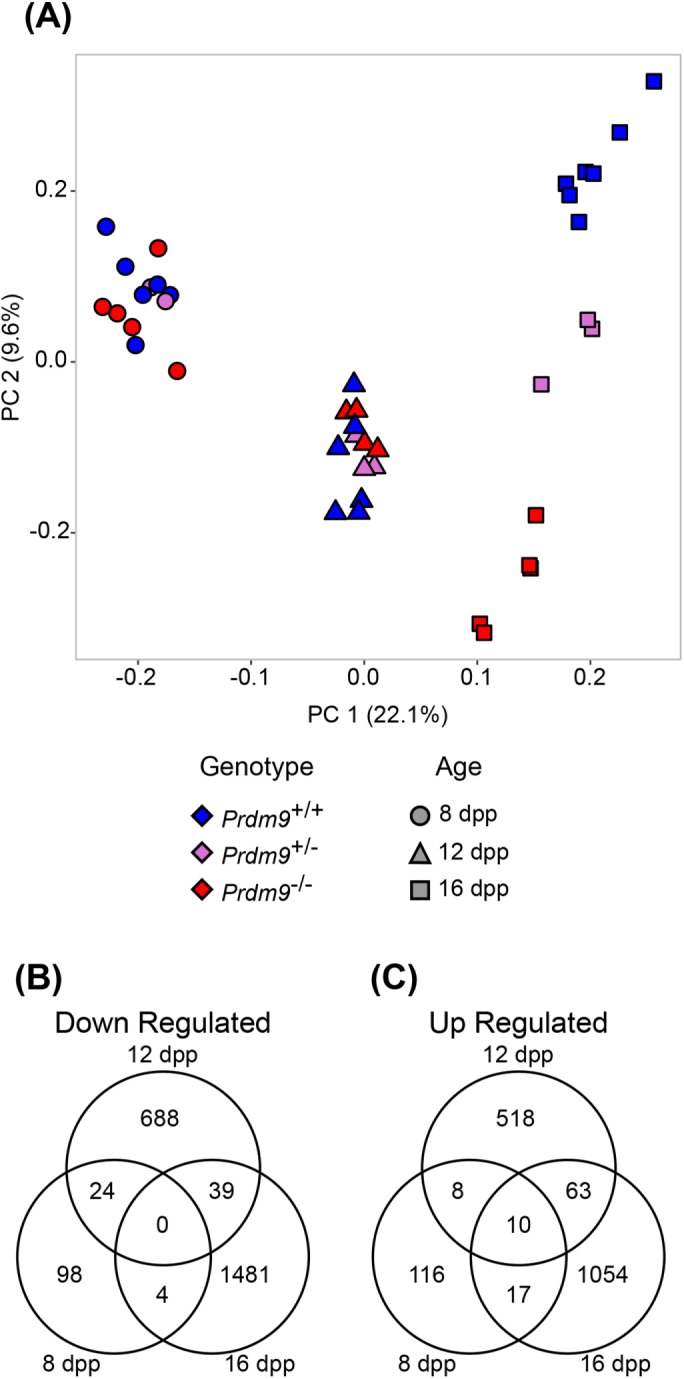
ComBat-adjusted data of gene expression across genotype and age conditions shows differential expression between Prdm9+/+ and Prdm9–/– samples. (A) Principal component 1 (PC1) vs. principal component 2 (PC2) from PCA of all ComBat-adjusted samples. Colors denote genotype, and shapes denote sample age, as indicated. (B, C) Shared and unique differentially expressed transcripts with decreased or increased abundance in Prdm9–/– samples compared with Prdm9+/+. FDR < 0.01 and LFC > 0.5 for B and C.