FIGURE 3:
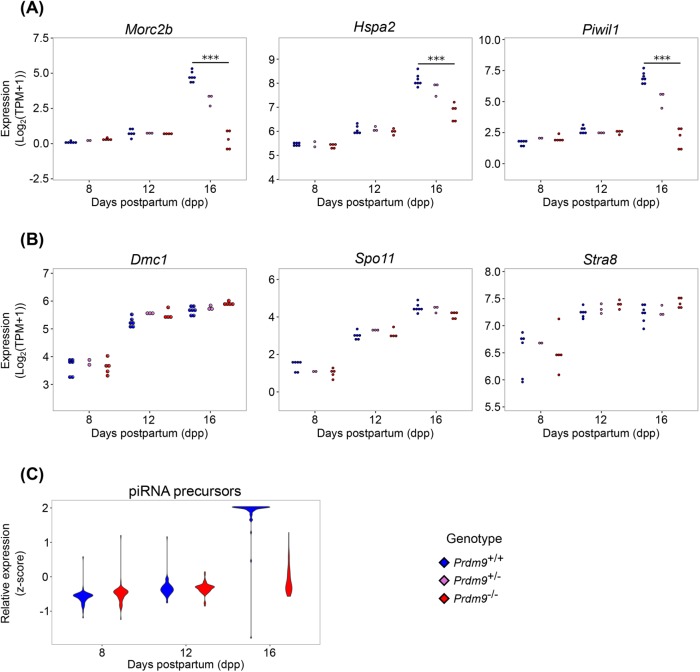
Changes in expression of specific meiotic gene reflect abnormalities and meiotic arrest in Prdm9–/– germ cells. Colors denote genotypes, as indicated. (A) Log2(TPM+1) expression of Morc2b, Hspa2, and Piwil1 at 8, 12, and 16 dpp. (B) Log2(TPM+1) expression of Dmc1, Spo11, and Stra8 at 8, 12, and 16 dpp. (C) Relative expression of piRNA precursors at 8, 12, and 16 dpp. *** represents FDR < 0.0001.

