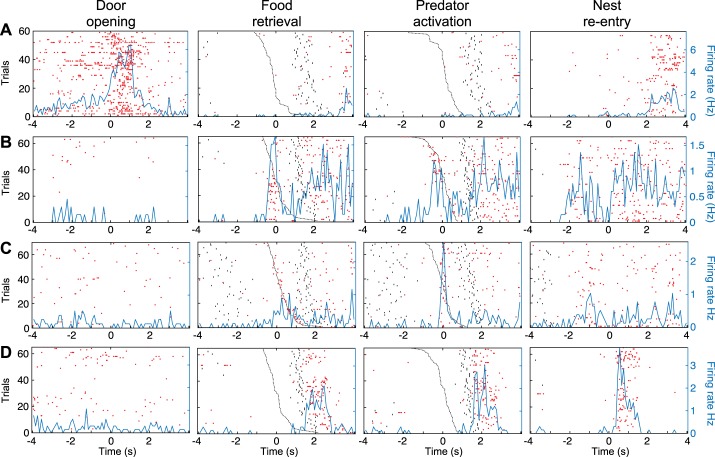
Fig. 2.
Examples of units specifically activated by only one task event. A–D: data for 4 different principal neurons (PNs), respectively, are spike rasters (red dots) and superimposed perievent time histograms (PETHs) of neuronal discharges (blue lines) referenced to the event listed at top of each column. In second column, raster trials were rank ordered by latency of predator activation (black dashed line). In third column, raster trials were rank ordered by latency of food retrieval (black dashed line). Black dots before or after time 0 in the PETHs mark when rats started foraging (left of origin) or reentered the nest (right of origin).

