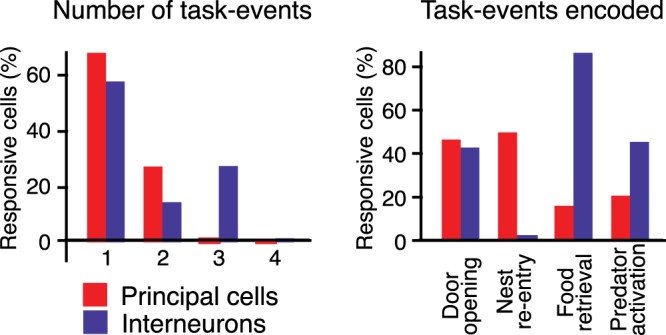
Fig. 6.

Contrasting responsiveness of principal neurons (PNs) and interneurons (ITNs). Left: proportion of responsive units (y-axis) that increased their activity in relation to 1, 2, 3, or 4 task events. Red, PNs; blue, ITNs. Right: proportion of units (y-axis) responding to the task events listed along the x-axis.
