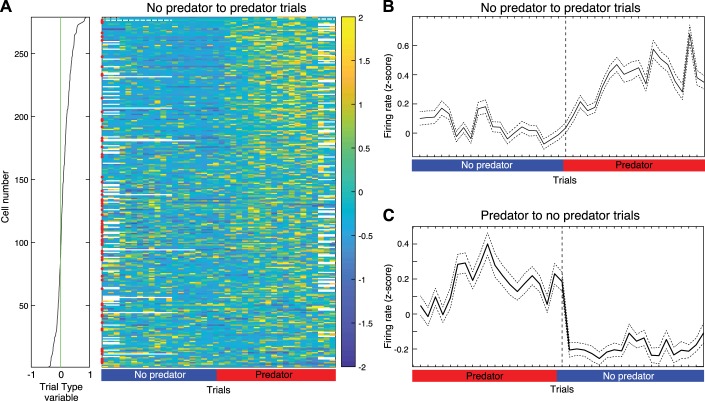
Fig. 10.
Change in unit activity at transitions between trial blocks. Units were rank ordered (A) on the basis of their modulation by the trial type variable (see Fig. 9A). Their average firing rate during the baseline and waiting phases was then plotted trial by trial (x-axis) around transitions between trial blocks from no-predator to predator trials (A and B) and from predator to no-predator trials (C). In A, firing rate is z-scored and color coded (bar at right). Red dots on the left of the central panel mark event cells. In B and C, solid lines are average firing rate of all available units; dashed lines are SE.

