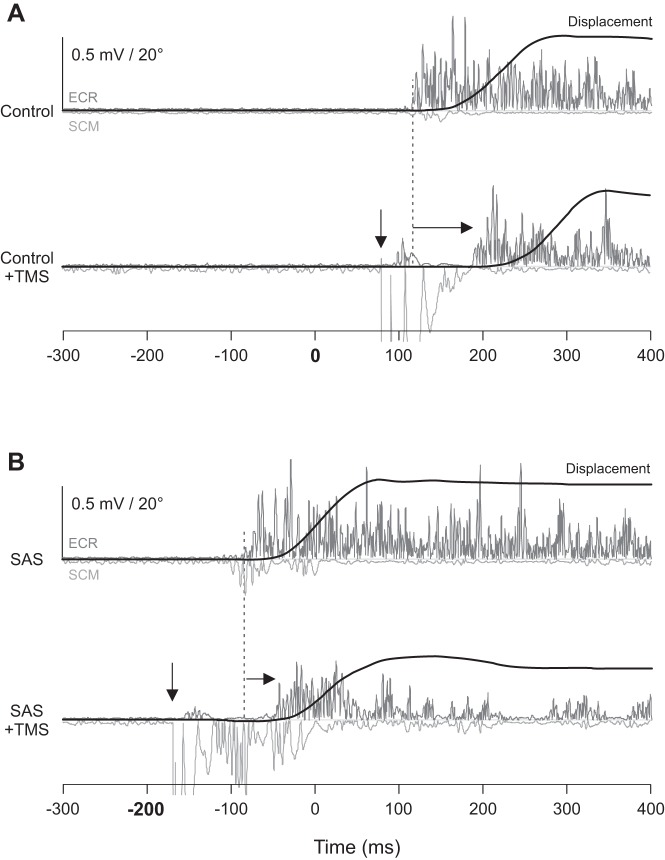
Fig. 2.
Experiment 1 example individual trial displacement data (black) and electromyogram (EMG) from the extensor carpi radialis (ECR; dark gray) and sternocleidomastoid (SCM; light gray) muscles from a representative participant in the extension movement conditions. A: control acoustic stimulus occurred at 0 ms. Top traces show EMG from a no-transcranial magnetic stimulation (TMS) control trial; bottom traces show EMG from a trial where TMS was delivered 80 ms following the acoustic stimulus (down arrow; large artifact visible in SCM EMG trace followed ~20 ms later by a motor evoked potential in ECR and silent period). Note that TMS leads to delayed premotor reaction time (RT) compared with no TMS (right arrow from dashed vertical line). B: startling acoustic stimulus (SAS) occurred at −200 ms. Top traces show EMG from a no-TMS SAS trial; bottom traces show EMG from a trial where TMS was delivered 30 ms after the SAS. Note that in SAS trials, TMS leads to a smaller delay in premotor RT compared with control trials. Only the extension movements are shown, because similar effects were observed between flexion and extension conditions.

