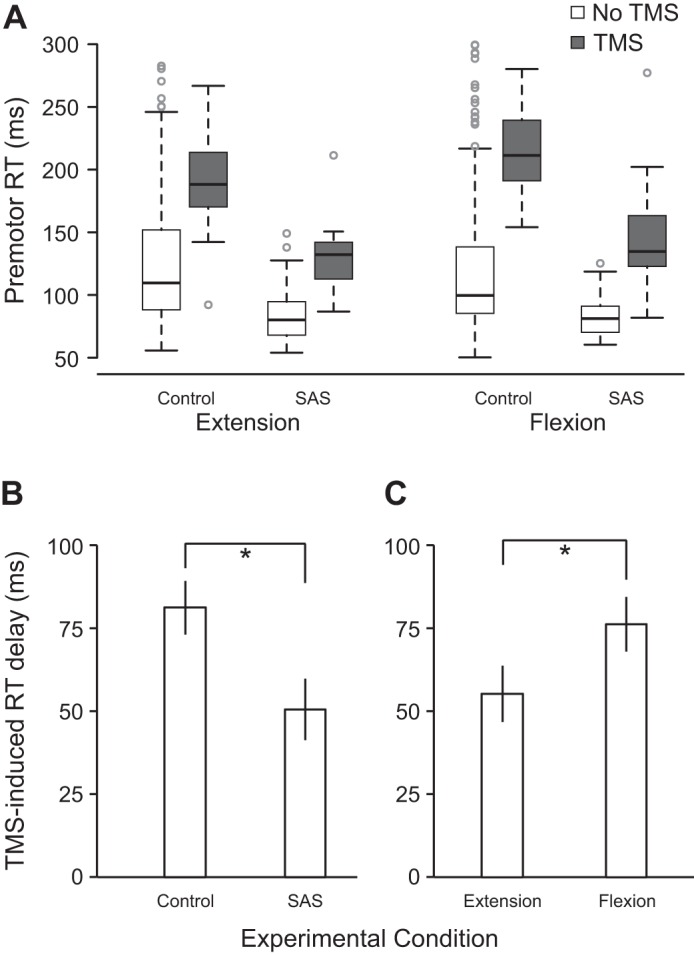
Fig. 3.

Premotor reaction time (RT) as a function of movement, acoustic stimulus, and transcranial magnetic stimulation (TMS) conditions in experiment 1 (n = 6). A: boxplots of RT in all 8 conditions. Box ends (fences) represent upper and lower quartiles, the line dividing the box represents the median, the whiskers represent the highest and lowest data points within 1.5 times the interquartile range from the fences, and circles represent outlier data points. B: RT delay induced by TMS (means ± SE) collapsed across movement type for control and startling acoustic stimuli (SAS). *P < 0.05, significant difference between variables. C: RT delay induced by TMS (means ± SE) collapsed across acoustic stimulus type for extension and flexion movements. Linear mixed-effects analysis statistical values are shown in Table 1. *P < 0.05, significant difference between variables.
