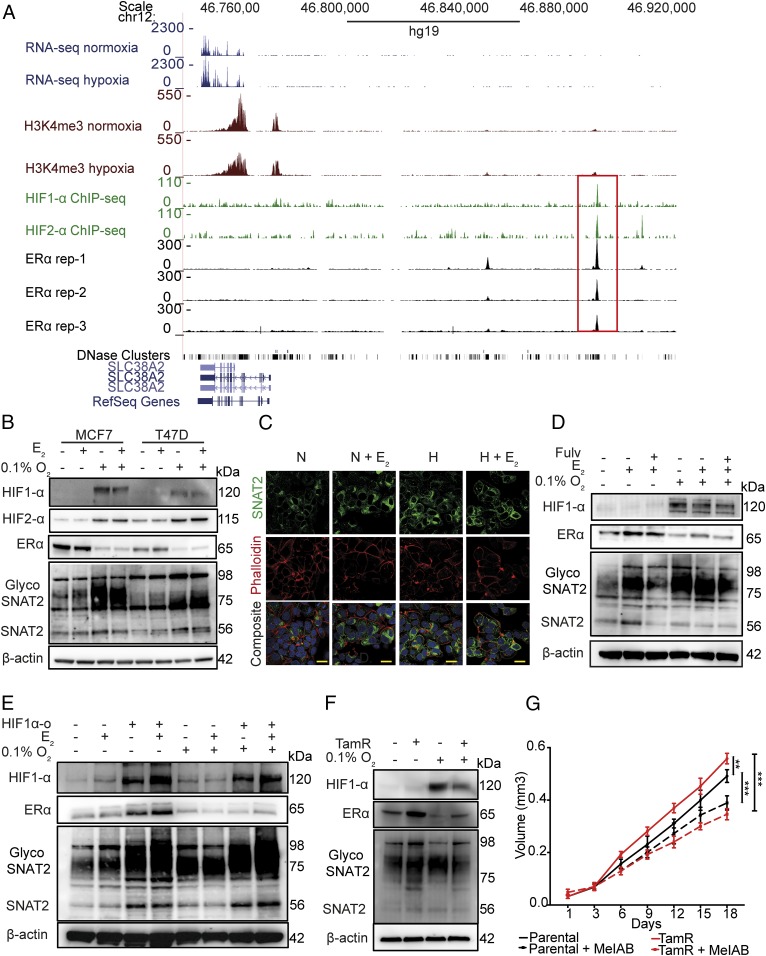
Fig. 4.
SNAT2 expression is independently modulated by ERα and HIF-1α, and is up-regulated in a tamoxifen-resistant cell line. (A) RNA-seq and ChIP-seq genome-browser tracks illustrating occupancy of HIF-1α (Top), HIF-2α (Middle), and ERα (Bottom) at the same genomic coordinates on chromosome 12. The same plots for H3K4me3 are shown. Peaks (red box) represent the areas where transcription factors interact with DNA. (B) Western blotting for SNAT2, ERα, HIF-1α, and HIF-2 in MCF-7 and T47D cells treated with 10 nM E2 in normoxia and hypoxia (0.1% O2) for 48 h. β-Actin is shown as a loading control. (C) Confocal microscopy of SNAT2 (green), phalloidin (F-actin, red), and DAPI (blue) in MCF7 in normoxia (N) and hypoxia (H; 0.1% O2) with or without E2 treatment (E; 10 nM) for 24 h. (D) MCF7 cells were grown in a charcoal-stripped, phenol-free medium for 3 d and then incubated with or without fulvestrant (Fulv; 10 μM) and with or without 10 nM E2 in normoxia and hypoxia (0.1% O2) for 48 h. β-Actin is shown as a loading control. (E) MCF7 control and MCF7-HIF1α-o cells were treated with or without 10 nM E2 in normoxia and hypoxia (0.1% O2) for 48 h. β-Actin is shown as a loading control. (F) Representative Western blots of parental (MCF7-par) and MCF7 tamoxifen-resistant cells (MCF7-TamR) cultured in normoxia and hypoxia (0.1% O2) for 48 h. (G) Graph of the effect of MeIAB (10 mM) treatment on MCF7 and MCF7-TamR spheroid growth. Error bars indicate SD. **P < 0.05, ***P < 0.01; two-way ANOVA (n = 4).

