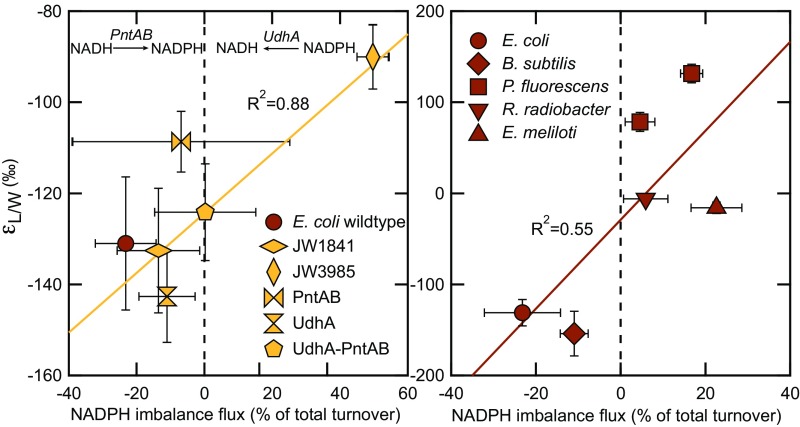
Fig. 3.
The relationship between lipid/water fractionation () and relative NADPH imbalance flux in five E. coli knockout mutants (plus wild type; Left) and in six wild-type species (Right). Negative values indicate NADPH underproduction; positive values indicate NADPH overproduction. E. coli balances NAPDH levels via membrane-bound (PntAB) and soluble (UdhA) transhydrogenases. For all other species, the mechanism to balance NADPH levels is currently unknown. Not included in the linear regression is the mutant PntAB because the NADPH underproduction in this mutant is not balanced by PntAB.

