Fig. 1.
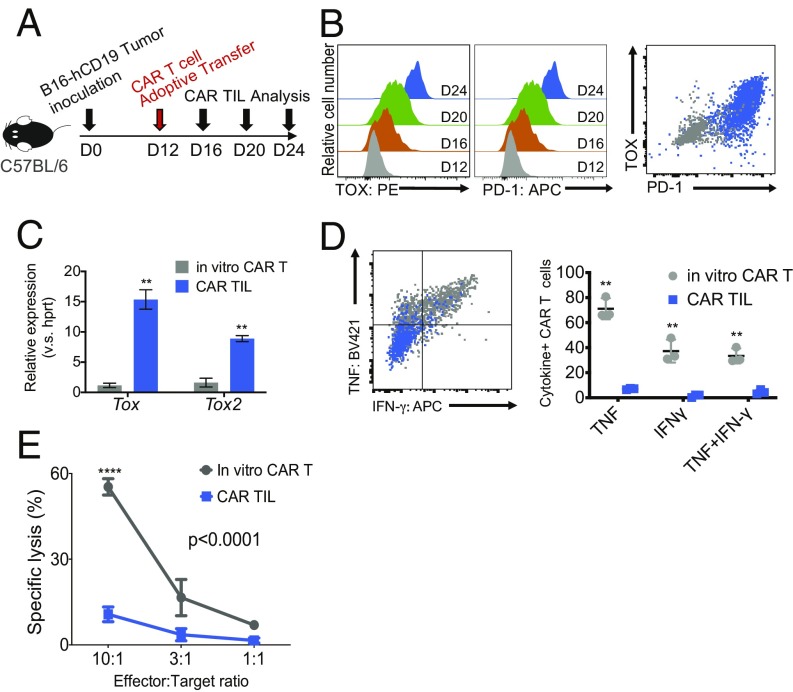
TOX transcription factors are highly expressed in exhausted CAR TILs in solid tumors. (A) Experimental scheme for analyzing tumor-infiltrating CAR T cells (CAR TILs); 5 × 10⁵ B16-hCD19 tumor cells were inoculated subcutaneously into C57BL/6 mice. Twelve days later, 1.5 × 10⁶ CAR T cells were adoptively transferred into the tumor-bearing mice by intravenous injection. CAR TILs were isolated every 4 d after CAR T cell transfer. (B–E) Gray color (dots, histograms, and shading) indicates T cells retrovirally transduced with the CAR and analyzed in vitro, and the orange, green, and blue colors indicate CAR TILs analyzed the indicated number of days after CAR T cell transfer. (B, Left and Center) Expression of TOX and PD-1 was analyzed by flow cytometry (PE: phycoerythrin, APC: allophycocyanin). Shown are histograms for TOX and PD-1 expression of CAR TILs on days 12, 16, 20, and 24 after tumor inoculation; “in vitro CAR T” refers to CAR T cells before adoptive transfer. (B, Right) Combined flow cytometry plot showing PD-1 and TOX expression on in vitro-transduced CAR T cells (gray) as well as CAR TILs isolated on day 24 (blue). (C) mRNA expression levels of Tox and Tox2 (relative to Hprt) in bulk CAR TILs on day 24. (D, Left) Representative flow cytometry plot showing TNF and IFN-γ expression after EL4-hCD19 cells restimulation in in vitro-transduced CAR T cells (gray) and CAR TILs isolated on day 24 (blue). (D, Right) Quantification of cytokine production (three mice per group). The data from C and D were analyzed by Student’s t test. **P ≤ 0.01. (E) In vitro-transduced CAR T cells and CAR TILs were cocultured with tumor cells expressing MC38-hCD19, and target cell lysis was measured 5 h later. The data are representative of two biologically independent experiments. The data from the two groups in E were analyzed by two-way ANOVA with a Bonferroni multiple comparisons test. ****P ≤ 0.0001.

