FIGURE 2:
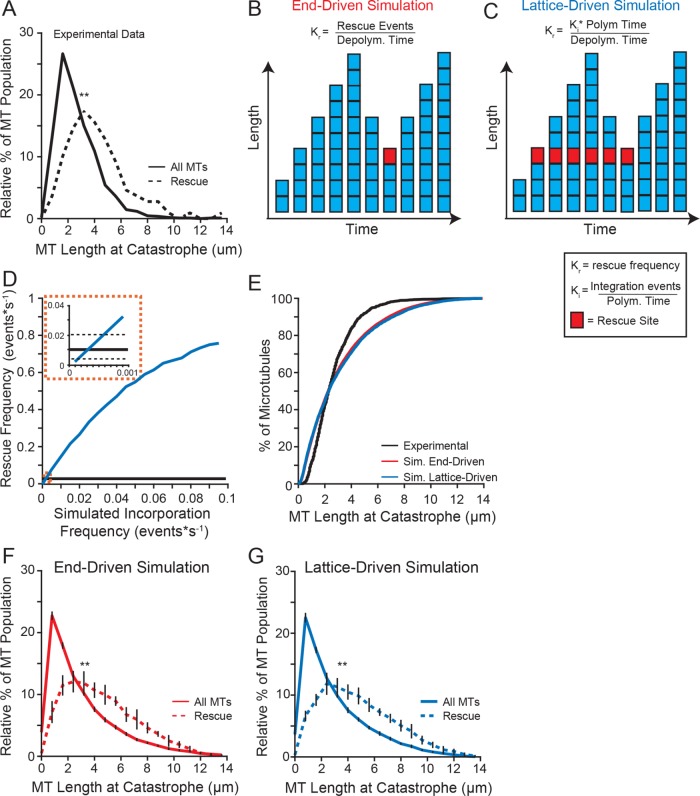
Longer microtubules are more likely to rescue. (A) Relative distribution of microtubule lengths at catastrophe leading to rescue (dashed line) compared with the entire population (solid line) of the experimental data under standard conditions (5 mM MgCl2). Data represent 1127 microtubule lengths from 525 stabilized seeds, pooled from five separate experiments at the following tubulin concentrations: 4.8, 5.4, 5.8, 7.0, 7.2 µM. (B) Schematic of our end-driven simulation. Rescue site is denoted by a red square. Rescue frequency is defined as the number rescue events per depolymerization time. Rescues were triggered stochastically during depolymerization at the experimentally derived rescue frequency (0.01 events*depolymerization s−1). (C) Schematic of our lattice-driven simulation. Rescue sites (denoted by a red square) are incorporated during polymerization, and always trigger rescue when the depolymerizing end returns to that site. (D) Simulated rescue frequency as a function of incorporation frequency. The simulated rescue frequency for each incorporation rate calculated from 1000 simulated microtubules. (E) Cumulative distribution of microtubule lengths at catastrophe under standard conditions (black) compared with end-driven simulation (red) and the lattice-driven simulation (blue). (F) Similar to A, using data from the end-driven simulation. Error bars represent SD from 10 separate simulations of 20,000 microtubule seeds. (G) Similar to A, using data from the lattice-driven simulation, with the incorporation frequency set to 0.0001 events*s−1. Error bars represent SD from 10 separate simulations of 20,000 microtubule seeds. Significance determined by Kolmogorov-Smirnov test (F and G) or Mann-Whitney U test (A). **: p < 0.001.

