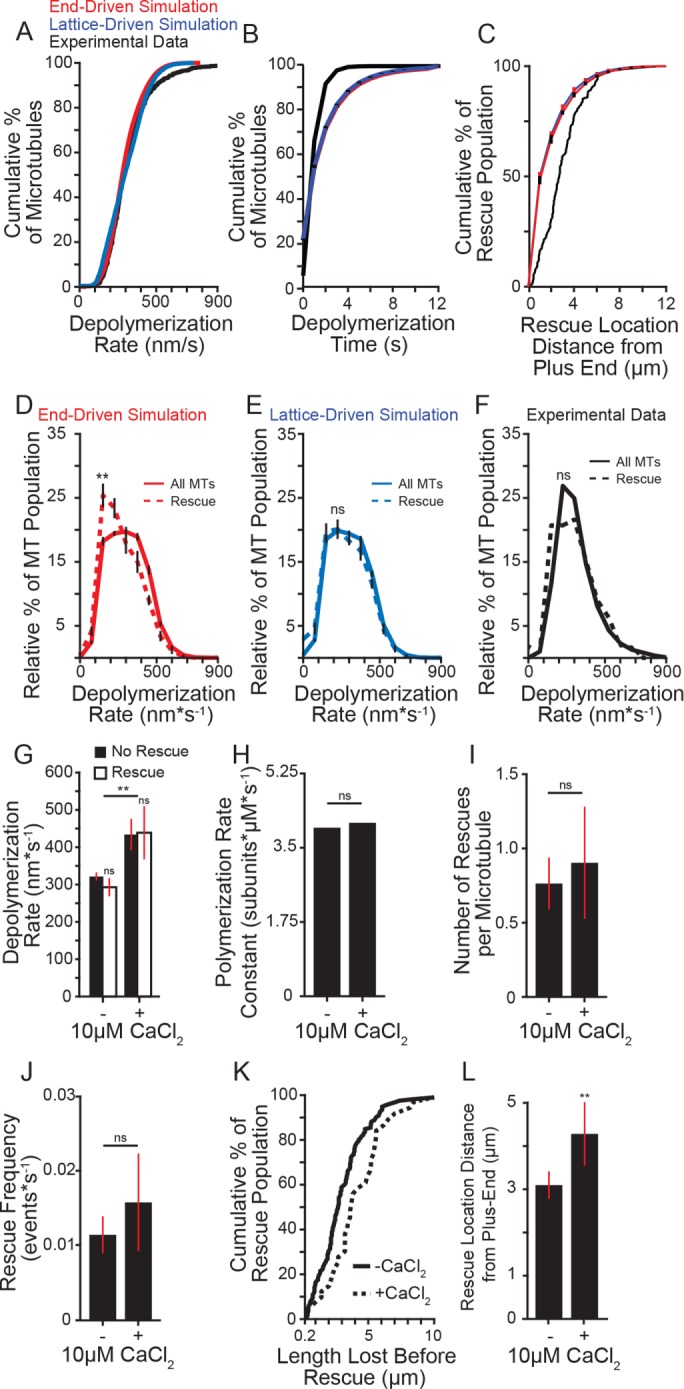
FIGURE 3:

Effect of depolymerization rate on rescue. (A) Cumulative distribution of depolymerization rates of experimental data under standard conditions (5 mM MgCl2; black) compared with the end-driven simulation (red) and the lattice-driven simulation (blue). (B) Cumulative distribution of microtubule depolymerization times (s) of experimental data under standard conditions (5 mM MgCl2; black) compared with simulated microtubules from the end-driven and lattice-driven models (red and blue, respectively). Error bars represent SD from 10 separate simulations of 20,000 microtubule seeds. (C) Cumulative distribution of rescue location relative to the microtubule plus end of experimental data under standard conditions compared with the simulated models as in A and B. Error bars represent SD from 10 separate simulations of 20,000 microtubule seeds. (D) Relative distribution of depolymerization rates leading to rescue (dashed line) compared with entire population (solid line) of the end-driven simulation. Plot represents 10 separate simulations of 20,000 simulated microtubules per simulation. Error bars represent SD. (E) Relative distribution of depolymerization rates leading to rescue (dashed line) compared with entire population (solid line) of the lattice-driven model. Error bars represent SD. (F) Relative distribution of depolymerization rates leading to rescue (dashed line) compared with entire population (solid line) from experimental data under 5 mM MgCl2 conditions. Rescue data represent 165 depolymerization events from 112 microtubules; solid line represents entire population data consisting of 1283 depolymerization events from 1164 microtubules from five separate experiments at the following tubulin concentrations: 4.8, 5.4, 5.8, 7.0, 7.2 µM. (G) Average depolymerization rates from experimental data of microtubules at 5 mM MgCl2, with or without 10 µM CaCl2, showing catastrophes terminating at the seed (No Rescue) compared with those terminating at a rescue site within the lattice (Rescue). Significance determined by comparing rescue to no rescue for each condition as well as rescue across conditions. Bars represent mean ± 95% CI, at least 230 depolymerization events from at least three experiments from at the following tubulin concentrations: -CaCl2: 4.8, 5.4, 5.8, 7.0, 7.2 µM; + CaCl2: 5.3, 6.4, 6.9 µM. (H) Average polymerization rate constants from experimental observations of at least 275 microtubules for each condition at tubulin concentrations listed for G. (I) Average number of rescues per microtubule with and without 10 µM CaCl2. Bars represent mean ± 95% CI from at least 275 microtubules over at least three separate experiments for each condition at tubulin concentrations listed for G. (J) Average rescue frequency calculated as events per depolymerization time. Bars represent mean ± 95% CI from at least 275 microtubules over at least three experiments per condition at tubulin concentrations listed for G. (K) Cumulative distribution of the length lost before rescue with and without CaCl2 at tubulin concentrations listed for G. (L) Mean ± 95% CI of the rescue position relative to the catastrophe site. Position defined as the difference of microtubule length at catastrophe and length at rescue. Bars represent at least 39 length measurements from 25 microtubules from at least three separate experiments at tubulin concentrations listed for G. **: p ≪ 0.001; ns: not significant. Significance determined by Mann-Whitney U test (F–L) or Kolmogorov-Smirnov test (B–E).
