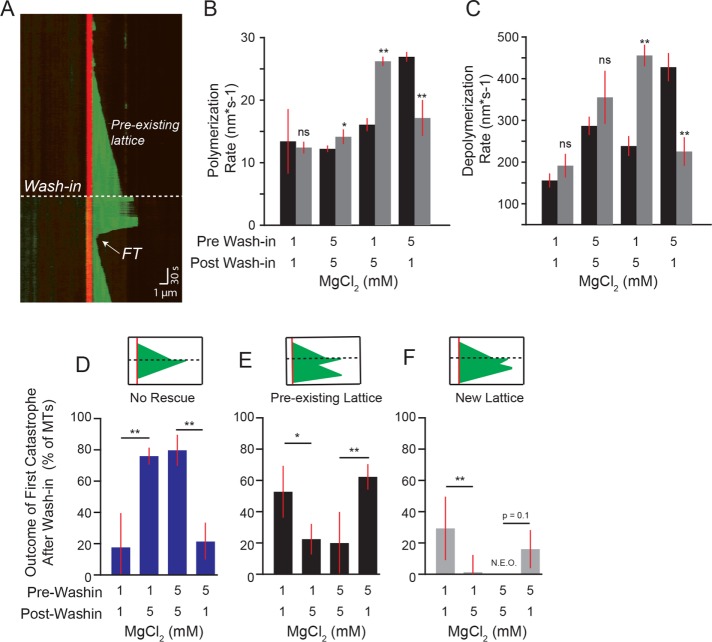
FIGURE 6:
Rescue activity is determined during depolymerization. (A) Representative kymograph of wash-in experiment. Dashed line denotes the wash-in timepoint. Dashed line denotes the preexisting lattice before wash-in. The first termination site after wash-in (FT) denoted with arrow (see D–F). Image acquisition was paused during wash-in and resumed immediately afterward (see Materials and Methods). Images were collected at 1-s intervals. Tubulin concentration: 3.2 µM, pre-wash-in = 5 mM MgCl2 and post-wash-in = 5 mM MgCl2, vertical scale bar = 30 s and horizontal scale bar = 1 µm. (B) Polymerization rates of microtubules before (black bars) and after (gray bars) wash-in for each condition. Bars represent mean ± 95% CI of pooled data from at least 43 polymerization rates from 30 microtubules and a minimum of three separate experiments from the following tubulin concentrations: 5.3, 5.7, 5.9, 6.1, 6.3, 6.6, 6.9, 7.6, 8.0 µM. Significance denotes differences between rates before and after wash-in. (C) Depolymerization rates of microtubules before (black bars) and after (gray bars) wash-in for each condition from tubulin concentrations listed for B. (D) Percent of first catastrophes after wash-in that depolymerize to the stabilized seed and did not rescue. Bars in D–F represent mean ± SEP from data pooled from tubulin concentrations listed for B. (E) Percent of first catastrophes after wash-in that rescue within the preexisting lattice. (F) Percent of first catastrophes after wash-in that rescue within lattice added after wash-in. **: p ≪ 0.001; *: p < 0.05; ns: not significant. Significance determined by Fisher’s exact (D–F) and Mann-Whitney U test (B and C).

