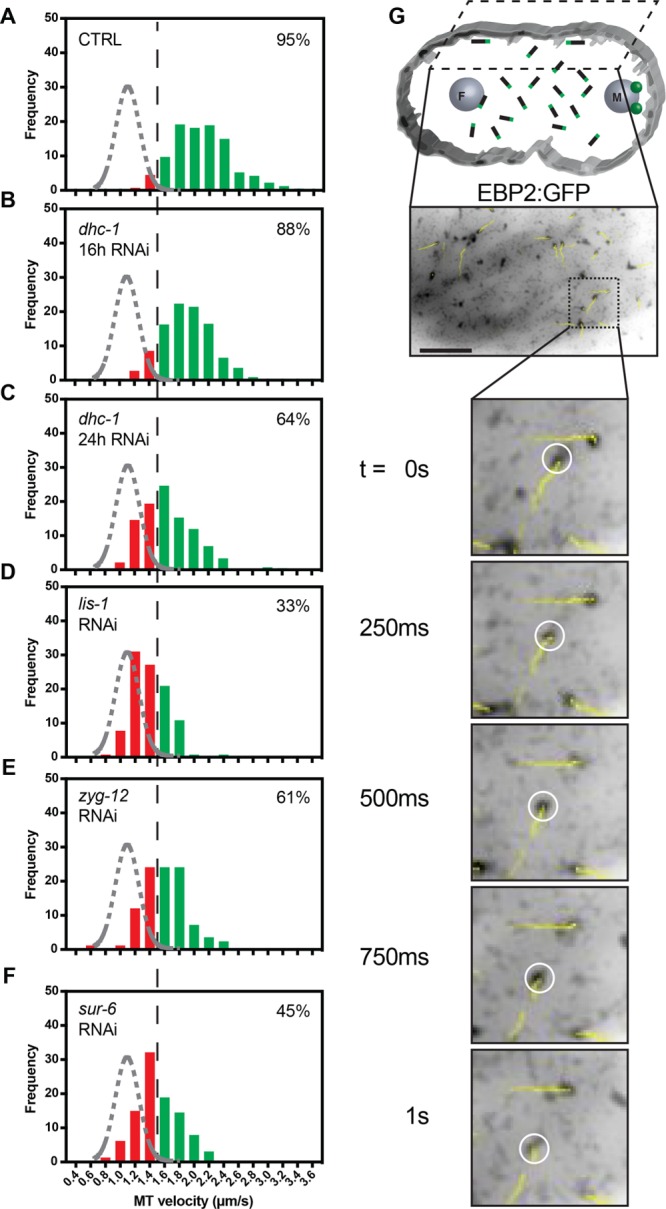
FIGURE 4:

PP2A-B55/SUR-6 regulates dynein-dependent microtubule growth velocity acceleration at the cortex. (A–F) Frequency distributions of EBP2:GFP foci velocities for microtubules polymerizing along the cortex of the embryo before pronuclear migration as visualized by TIRF microscopy. The black dashed line represents a threshold over which microtubules are assumed to be accelerated by cortical dynein. The gray dashed curve represents a Gaussian distribution fit to control unaccelerated cytoplasmic microtubule growth velocities. Microtubules analyzed per condition: n > 80 across > 3 embryos. Percentage inlays represent the proportion of microtubules growing at velocities above the 1.5 µm/s threshold in each condition. (G) Drawing illustrating the imaging plane, cytoplasmic microtubules in black with green plus ends representing EBP2, and representative single-plane confocal image of embryos expressing EBP2:GFP. Yellow trajectory lines represent tracks for up to 10 frames (2.5 s) following the displayed frame using TrackMate. Scale bar: 10 µm.
