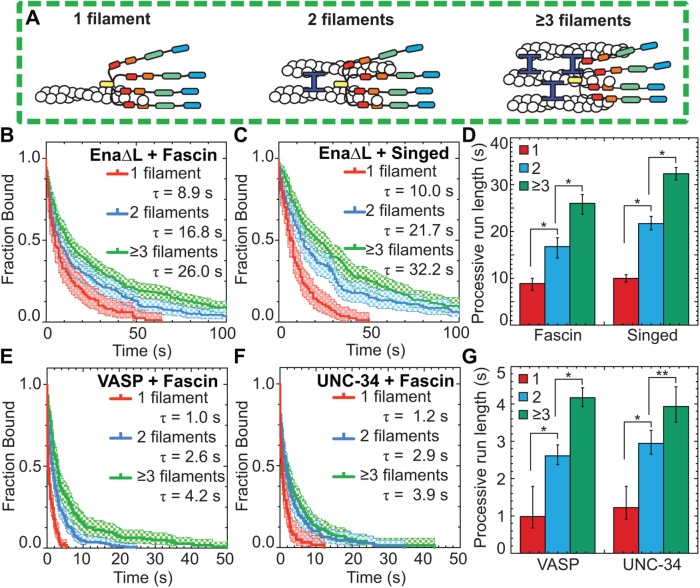
FIGURE 2:
Ena/VASP’s processive run length increases with the number of filaments in a fascin bundle. (A) Cartoons of Ena/VASP on a single filament and 2- and 3-filament fascin bundles. (B–G) Two-color TIRFM visualization of 1.5 µM Mg-ATP-actin (15% Oregon green-actin) with fly SNAP(549)-EnaΔL (red), human SNAP(549)-VASP or worm SNAP(549)-UNC-34 and unlabeled 130 nM human fascin or 250 nM Singed as indicated. (B, C) Kaplan–Meier curves representing average processive run lengths (τ) for 15 pM EnaΔL with (B) fascin or (C) Singed on single filaments (red), or bundles with 2 (blue) and ≥3 (green) filaments. Error bars, 95% CI. n ≥ 98. (D) Average processive run lengths for increasing number of filaments in fascin (yellow) or Singed (blue) bundles shown in B and C. Error bars, 95% CI. P values (* <0.0001). (E, F) Kaplan–Meier curves representing run lengths (τ) for (E) 25 pM VASP or (F) 18 pM UNC-34 with fascin on single filaments (red), or bundles with 2 (blue) and ≥3 (green) filaments. Error bars, 95% CI. n ≥ 60. (G) VASP and UNC-34 average processive run lengths for increasing number of filaments in fascin bundles shown in E and F. Error bars, 95% CI. P values (* <0.0001).

