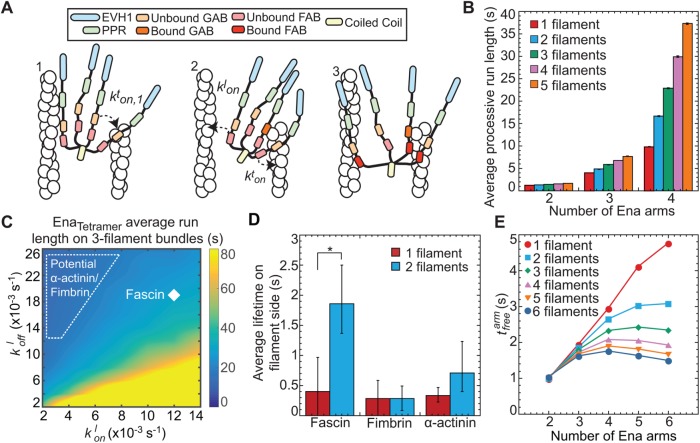
FIGURE 5:
Kinetic model of Ena/VASP on actin bundles shows that processivity positively correlates with both number of Ena arms and bundle size. (A) Modeling schematics showing (from left to right). 1) An Ena arm’s GAB domain binds the trailing barbed end with binding rate kton,1. 2) Once the GAB domain is bound, the FAB domain from the other arms binds to sides of either the trailing filament (kton) or leading filaments (klon). 3) Arms can be bound to the trailing filament, while others bind leading filaments. (B) Bar graph of the average processive run length as a function of number of Ena arms and bundle size. Error bars, SEM. (C) Heat map showing average Ena run length in the case of 3-filament bundles and four Ena arms, with systematic variations of klon and kloff in the simulations. Diamond denotes optimized rates for fascin bundles, and region within dotted line shows potential rates for α-actinin and fimbrin. (D) Average lifetime for SNAP(549)-EnaΔL association to the sides of single filaments (red) and 2-filaments bundled (blue) by fascin, fimbrin, or α-actinin. Error bars, 95% CI. P values (* <0.0001). (E) Average time between binding events ( ) for varying arm number and bundle size.

