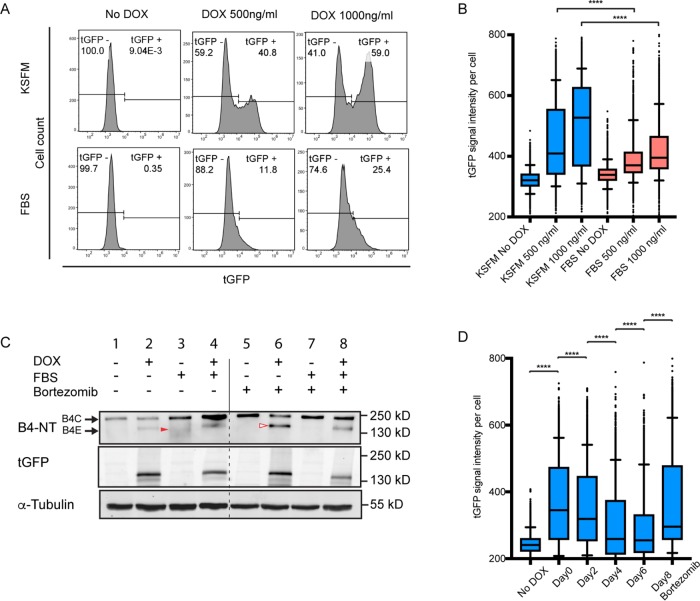
FIGURE 3:
Epithelium-specific regulation of integrin β4E expression and its suppression by serum-induced degradation. (A) Flow-cytometry analysis of the cell population (cell count) containing β4E-tGFP expression (tGFP) in KSFM or in media containing FBS, with or without two concentrations of doxycycline for 24 h. (B) The distribution of the β4E-tGFP (tGFP) intensity per cell is shown under the same conditions as A. In the box-and-whisker plot, whiskers indicate 5–95% percentile range, and dots indicate outliers. Statistical significance was determined by unpaired t test, (****, p < 0.0001). (C) Whole-cell lysate and Western blot analysis of integrin β4C, β4E, and β4E-tGFP (tGFP) expression in cells treated with either 1µg/ml doxycycline in the presence or absence of serum (FBS) or 50 nM bortezomib, using tubulin (α-tubulin) as the loading control. Note that the red filled arrowhead indicates β4C degradation and the red open arrowhead indicates β4E. (D) β4E-tGFP (tGFP) induction intensity per cell in the population either without (No DOX) or with 500 ng/ml doxycycline treatment done immediately after plating (Day 0) or after 2, 4, or 6 d in KSFM, or after 8 d in KSFM and then treated with 50 nM bortezomib for 18 h before analysis. Samples were analyzed by flow cytometry. Data are shown as a box-and-whisker graph. In the box-and-whisker plot, whiskers indicate 5–95% percentile range, and dots indicate outliers. Statistical significance was determined by unpaired t test (****, p > 0.0001).

