FIGURE 4:
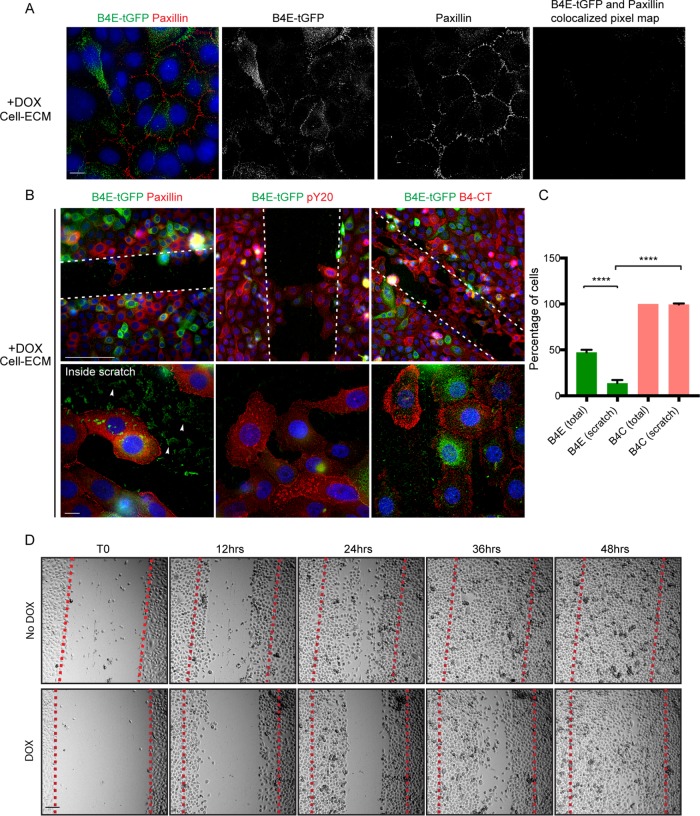
Integrin β4E-tGFP at cell–ECM adhesion sites is independent of paxillin or cell migration. (A) Epifluorescence images at the cell–ECM show the distribution of β4E-tGFP (green), paxillin (red), and nuclei (blue) and the black-and-white split channel images and the colocalized pixel map. Scale bars: 10 microns. (B) Scratch-induced (white dotted lines) cell migration reveals the cell–ECM distribution of β4E-tGFP (green) and paxillin (red) (B, top left panel), or β4E-tGFP isoform (green) and phosphotyrosine (pY20, red) (B, top middle panel), or β4E-tGFP (green) and β4C (red) (B, top right panel). All image panels show nuclei (blue). Scale bars: 100 microns. Migrating cells (inside scratch) under each condition (B, bottom panels) are shown. All image panels show nuclei (blue). Scale bars: 10 microns. White arrowheads indicate residual β4E-tGFP (green) in ECM after scratch. (C) Quantification of the percentage of cells in B expressing either β4E-tGFP (total or within the scratch) or β4C (total or within the scratch). Data are shown as means ± SD (three independent experiments). Statistical significance determined by unpaired t test (****, p > 0.0001). (D) Time-lapse microscopy and representative time frames (0, 12, 24, 36, and 48 h) of migrating cells, either with or without doxycycline (DOX, No DOX) into the scratch (red dotted line). Scale bar: 100 microns.

