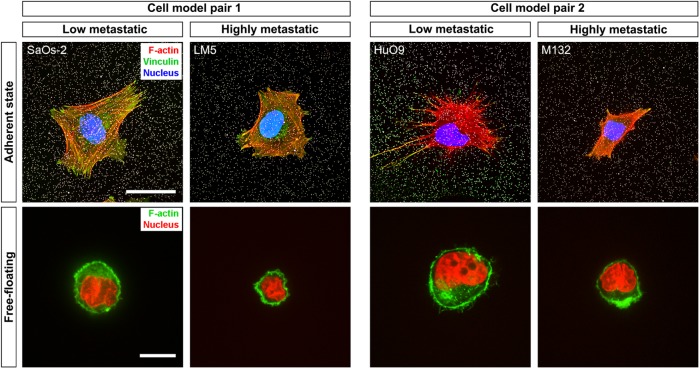
FIGURE 3:
Cell morphology. Cells were stained under two different conditions: cultured on substrates identical to those used in the tensile stiffness and TFM experiments and in the free-floating state. In the images of the cells on 2D substrates (top row), beads on the surface are displayed in white, nuclei in blue, actin cytoskeleton in red, and vinculin in green. The yellow color indicates colocalization of the signal of actin (in the stress fibers) and vinculin. In turn, in the free-floating state (bottom row), the actomyosin cortex, evidenced with phalloidin staining, is shown in green and nuclei in red. Scale bars: 30 μm (images of adherent cells); 15 μm (images of free-floating cells).

