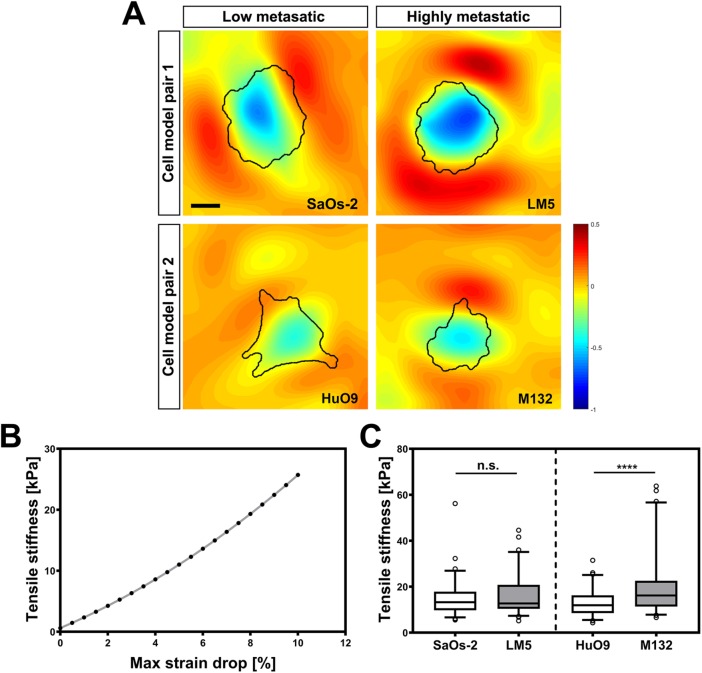
FIGURE 6:
Tensile stiffness estimation. (A) Strain distribution around and below the adhering osteosarcoma cells. (B) A finite-element model was developed to convert strain drop values into cell stiffness data. (C) Box plot representation of tensile stiffness of all four osteosarcoma cell lines showing 5th, 25th, 75th, and 95th percentiles and median values. Statistical analysis reveals significant differences between HuO9 and M132 cells and a similar trend in the SaOs-2/LM5. ****, p < 0.0001; n.s., not significant. Scale bar: 15 μm.

