FIGURE 7:
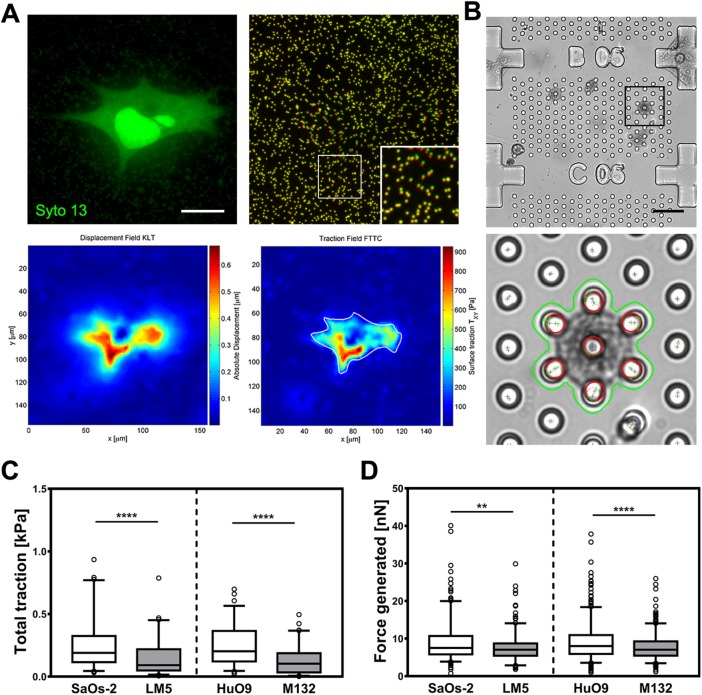
Traction force generation. (A) Representative 2D-TFM data set with attached cell (left), pseudo-colored bead images (right, green: before detachment; red: after detachment; inset represents an enlarged view of the boxed region), calculated displacement, and traction field heat maps. (B) Exemplary micropost array (top) with automatically segmented cell and tracked post tip in the deformed state (bottom). (C) Traction per cell measured using 2D-TFM and (D) forces using micropillar force sensors represented as box plot diagrams showing 5th, 25th, 75th, and 95th percentiles and median values. **, p < 0.01; ****, p < 0.0001. Scale bars: 15 μm (A); 40 μm (B).

