FIGURE 8:
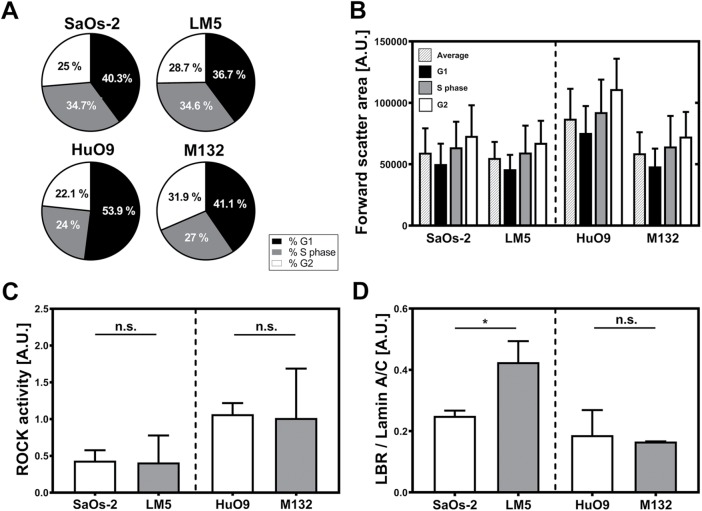
(A) Flow cytometry of cells stained with propidium iodide reveals similar cell numbers in G1, S, and G2 phases in the case of the SaOs-2/LM5 cell pair. In turn, HuO9 cell cultures display higher cell counts in G1 phase and less in G2 than the derived cell line M132. (B) Cells in different cell cycle phases display differences in their relative sizes measured as FSC-A. The average cell size (patterned bars) and the size of cells at the different cycle phases followed the same trend observed using other techniques, with the highly metastatic cells displaying smaller sizes. G1 (black bars), S phase (gray bars) and G2 (white bars). (C) ROCK activity shows no statistically significant differences in the osteosarcoma pairs. However, in both highly metastatic cell lines (LM5 and M132), the measured activity was slightly lower than in the parental cell lines (HuO9 and M132) (n = 4). (D) In turn, the ratio between LBR and lamin A/C is significantly higher in LM5 compared with SaOs-2 (p < 0.05), with no statistical differences in the other cell pair (n = 3). *, p < 0.05; n.s., not significant.

