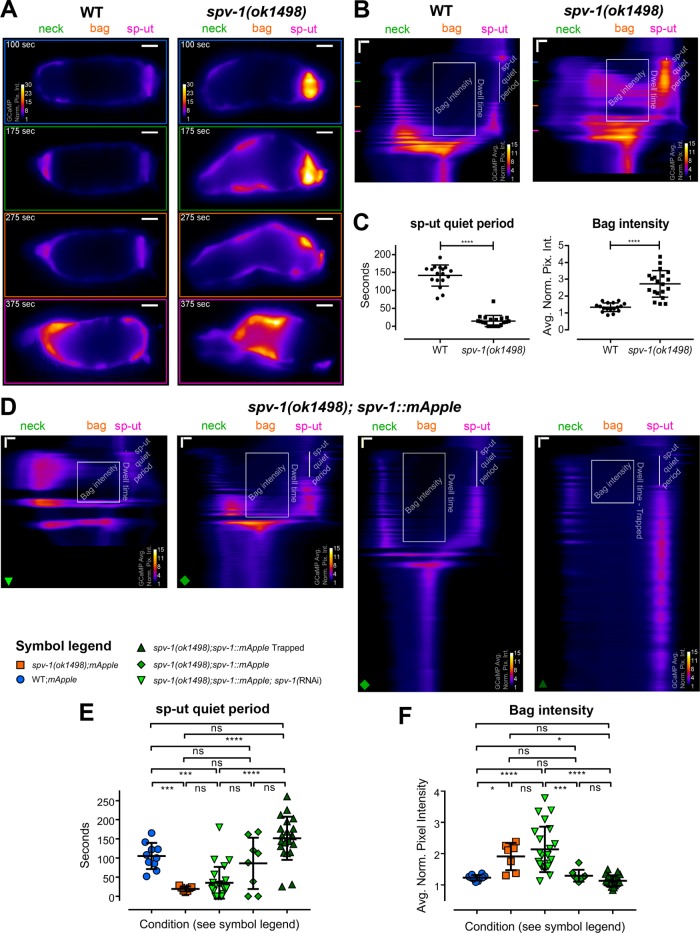
FIGURE 3:
SPV-1 regulates spatiotemporal aspects of calcium signaling. (A) Individual frames from wild-type (left) and spv-1(ok1498) (right) embryo transit movies, the same movies as Figure 1C. All frames follow the color scale indicated in the top frame. Scale bars: 10 μm. (B) Kymograms of the movies in A, generated by averaging over the columns of each movie frame, display the variation in average calcium signaling from the distal valve on the left to the sp-ut valve on the right, with time progressing down (Supplemental Movie 2). Horizontal scale bars: 5 μm; vertical scale bars: 50 s. Colored lines on the left side of the kymograms correspond to the individual frames in A; annotations show the two spatiotemporal calcium signaling metrics used for analysis. The sp-ut quiet period measures the low calcium signaling of the sp-ut valve after oocyte entry, which is lost in spv-1 mutants. Bag intensity measures the average normalized fluorescence intensity of a 25-μm-wide region in the bag section of the spermatheca during the dwell time. (C) Quantification of metrics. Error bars display SD, p values were calculated with Welch’s t test: ****, p < 0.0001. (D) Kymograms from embryo transit movies with SPV-1::mApple intensities of 2.5, 12.6, 16.9, and 78.5, from left to right. Horizontal scale bars: 5 μm; vertical scale bars: 50 s. (E) sp-ut quiet periods plotted as a function of condition. (F) Bag intensities plotted as a function of condition. In E and F, error bars display SD, and p values were calculated using Welch’s ANOVA with Games-Howell multiple comparison: ns, p ≥ 0.05; *, p < 0.05; ***, p < 0.001; ****, p < 0.0001.

