
FIGURE 8:
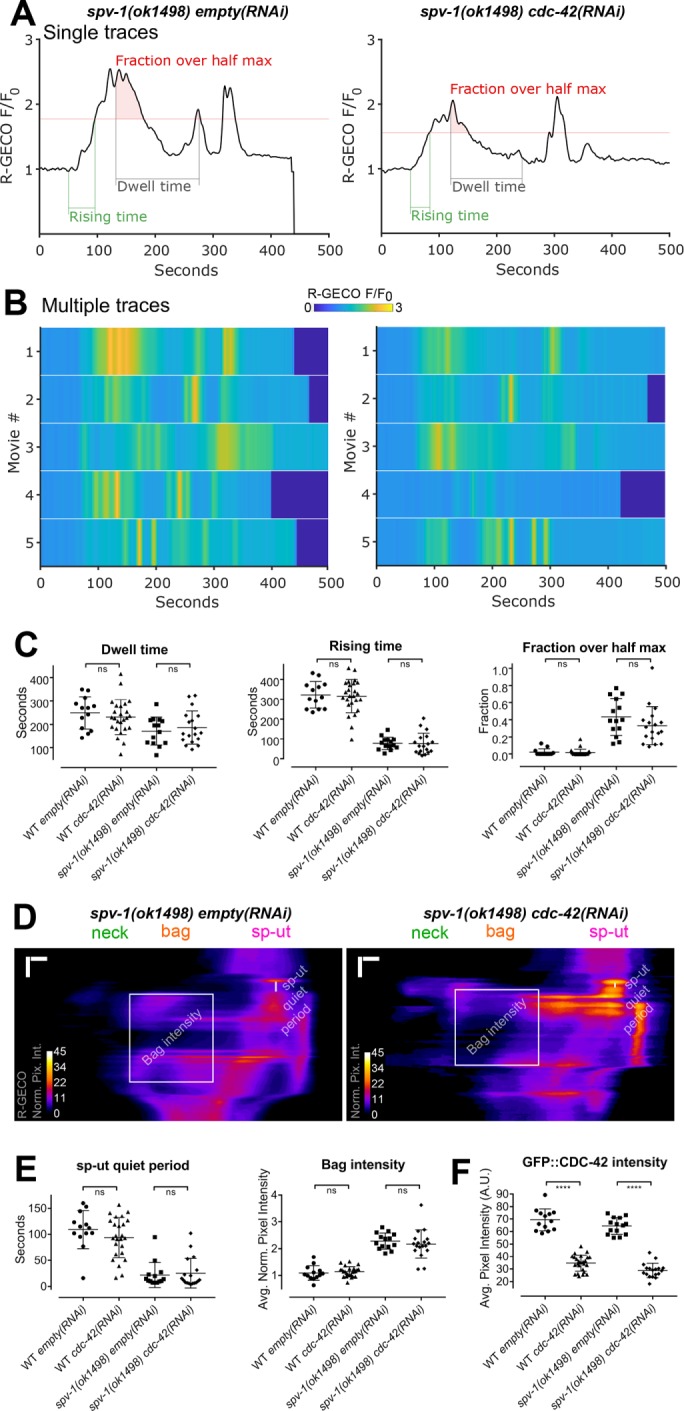
cdc-42(RNAi) does not alter calcium signaling. (A) Representative time series from embryo transits with metrics annotated. (B) Heat maps showing time series from multiple embryo transits. The time series in A corresponds to the first row of the heat map. (C) Quantification of time series metrics. (D) Representative kymograms with metrics annotated. Horizontal scale bars: 5 μm; vertical scale bars: 50 s. (E) Quantification of kymogram metrics. (F) Quantification of GFP::CDC-42 intensity. In C, E, and F, error bars display SD, and p values were calculated using Welch’s t test: ns, p ≥ 0.05; ****, p < 0.0001.