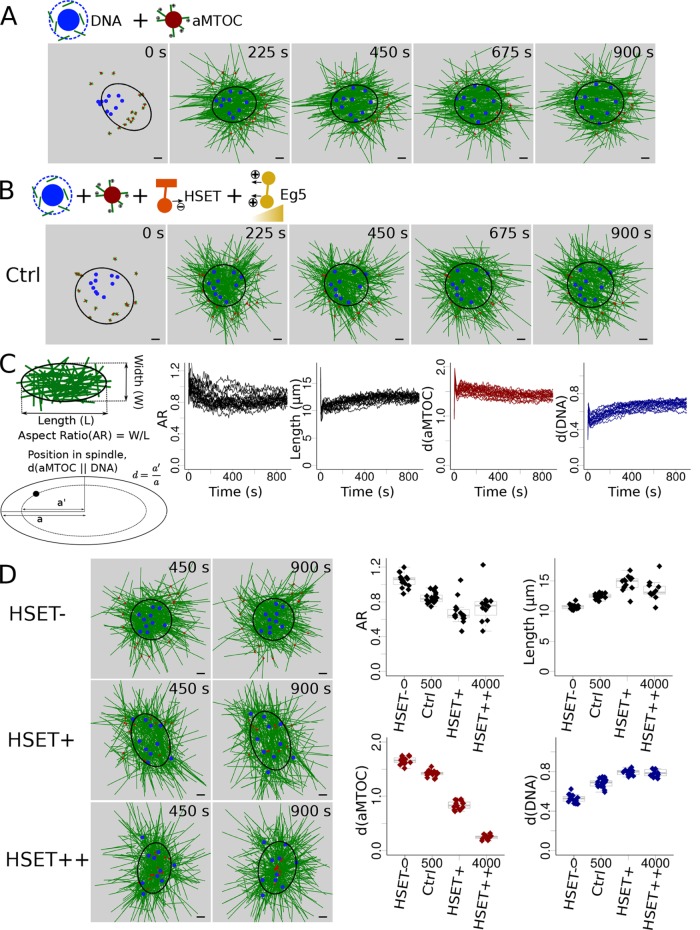
FIGURE 1:
HSET concentration impacts early stages of spindle assembly. (A) Snapshots of a simulation without motors (only MT dynamics and nucleation). (B) Snapshots of a simulation with HSET and Eg5 entities. (C) Analysis of the simulated spindles: schematic description of the measures used (left) to analyze multiple simulations (see Materials and Methods): evolution over time of the spindle aspect ratio (first graph), of spindle length (second graph), of aMTOCs position (third graph), and of DNA position (last graph). Each line represents an individual simulation. (D) Variation of the quantity of simulated HSET and its effect on spindle features. (Left) Snapshots of the simulations when HSET is inhibited (HSET-, top), overexpressed (∼3 times more, HSET+, middle), and highly overexpressed (∼8 times more, HSET++, bottom). (Right) Final values (at t = 900 s) of the spindle features (aspect ratio, top left; spindle length, top right; aMTOC position, bottom left; DNA position, bottom right) in 15 simulations for each of the 4 HSET quantities (HSET-, Ctrl, HSET+, HSET++). Microtubules are green, DNA beads mimicking chromosomes blue, aMTOCs red, HSET orange, and Eg5 dark yellow. Scale bar is 2 µm. For quantification, spindle shapes are fitted with ellipses (see Materials and Methods) represented in black.

