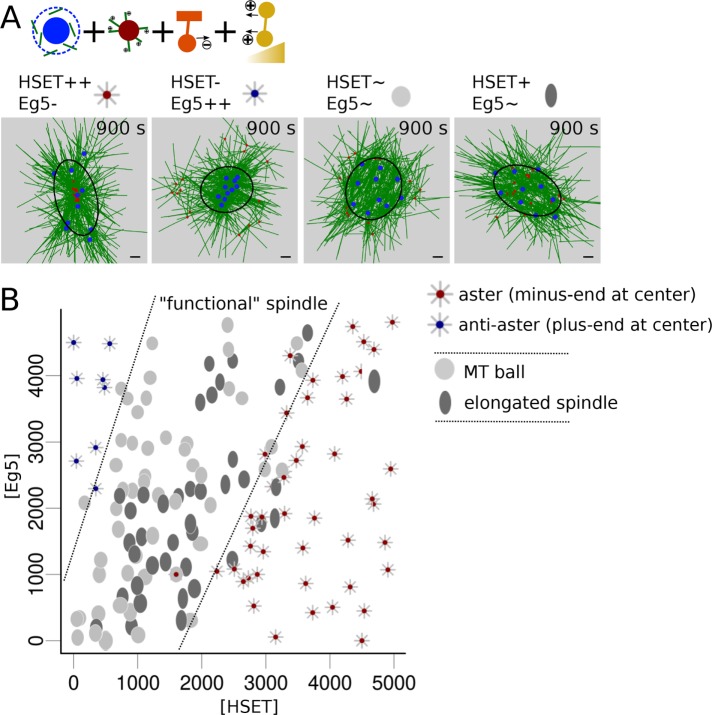
FIGURE 2:
A window of balanced HSET and Eg5 quantities promotes spindle elongation. (A) Final snapshots of simulations with varying amounts of HSET and Eg5. From left to right: high levels of HSET with low levels of Eg5 (HSET++ Eg5-, left); low levels of HSET with high levels of Eg5 (HSET- Eg5++); normal HSET and Eg5 levels (HSET∼ Eg5∼, Ctrl); high levels of HSET and normal levels of Eg5 (HSET+ Eg5∼, right). Four different morphologies can be identified: 1) aster with aMTOCs clustered in the center, represented by a gray aster with a red dot at the center; 2) inverted aster with DNA clustered toward the center, represented by a gray aster with a blue dot at the center; 3) microtubule ball represented as a gray ellipse (aspect ratio >0.75); and 4) elongated spindle represented as a darker ellipse (aspect ratio <0.75). Ellipses were represented with an aspect ratio and length scaled to their measured values. Microtubules are green, DNA blue, aMTOCs red, HSET orange, and Eg5 dark yellow. Scale bar is 2 µm and the black ellipses represent the fitted spindle ellipse. (B) Spindle morphologies at t = 900 s according to the respective amounts of simulated HSET and Eg5. Dashed lines (arbitrarily drawn) delimit the regime in which the microtubule structures do not collapse, thus leading to a “functional” spindle.

