FIGURE 4:
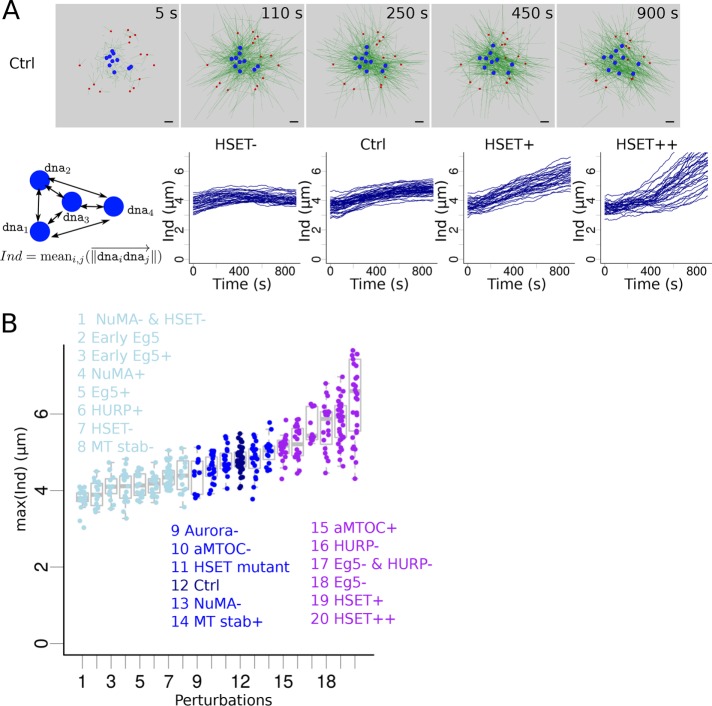
Impact of various perturbations on chromosome individualization. (A) (Top) Snapshots of a simulation with the Ctrl configuration, focusing on early time points. aMTOCs are red, microtubules are green and shown with thin lines for a better visualization of motion of DNA beads (blue). (Bottom) Measure of the DNA beads’ individualization score, Ind: the average distance between the DNA beads (cartoon). Evolution of the individualization score over time for different quantities of simulated HSET: inhibition (HSET-, first column), default (Ctrl, second column), slight overexpression (HSET+, third column), and high overexpression (HSET++, last column). Each line represents an individual simulation. (B) Maximal value of the individualization score reached during a simulation according to the perturbation applied to the system (sorted by maximal score). Perturbations were classified into three groups based on their maximal individualization scores compared with control’s: similar (middle, dark blue), lower (left, light blue), and higher (right, purple) individualization.

