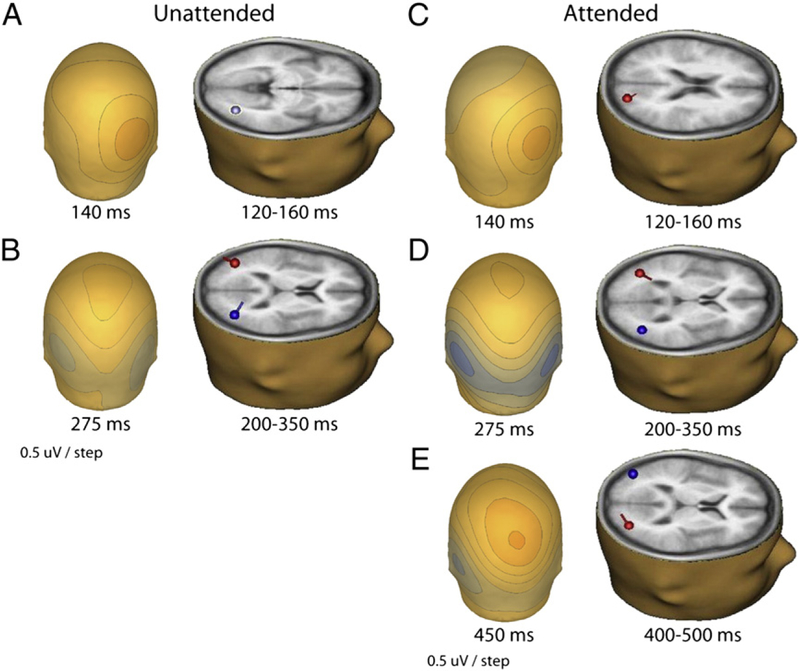
Fig. 6.
a. Scalp map of the difference between BM and SM responses at ~140 ms in the unattended task and the corresponding source localization for the 120 160 ms time-window (Talairach: x= 35, y= −69, z = −2; explained variance [EV] = 91%). b. Scalp map of the difference between BM and SM responses at ~275 ms in the unattended task and the corresponding symmetric sources localized for the 200 350 ms time-window (Talairach: x=±40, y= −69, z = 13; EV= 80%). c. Scalp map at ~140 ms of difference-waves between scrambled and canonical biological motion for the attended task and the corresponding source localized for the 120 160 ms time-window (Talairach: x= 23, y= −80, z = 20; EV= 81%). d. Scalp map at ~275 ms of the difference between scrambled and canonical biological motion for the attended task and the corresponding symmetric sources localized for the 200 350 ms time-window (Talairach: x=±40, y= −65, z = 7; EV= 89%). e. Scalp map at ~450 ms of the difference between scrambled and canonical biological motion for the attended task and the corresponding sources localized for the 400 500 ms time-window (Talairach: x= −37, y= −76, z= 16; x= 32, y = −77, z = 10; EV = 93%).

