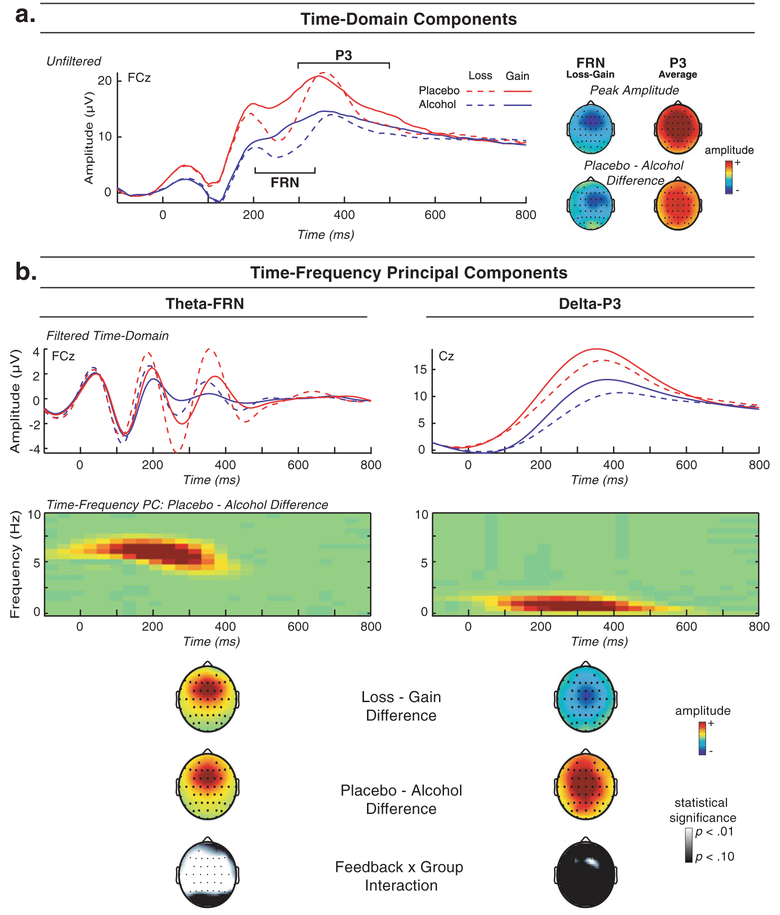
Fig. 2.
Results from time (a) and time–frequency (b) decompositions of ERP activity following loss and gain feedback for alcohol and placebo groups. a Waveform plot: average unfiltered ERP activity by feedback type (loss, gain) and group (alcohol, placebo) at FCz depicting the expected enhancement (negativity) following loss versus gain feedback for FRN, as well as the positive-going P3. Alcohol-related reductions in amplitude are apparent both in the FRN (loss–gain difference) and P3 (all trials). a Topographical maps: the upper topographical maps depict the overall frontocentral distribution of the FRN (loss–gain difference) measure as well as the more central distribution of the P3 (averaged across gain and loss trials). The lower topographical maps illustrate the topographical distribution of the group difference for each component (with the FRN group difference again being represented for the loss–gain difference). b Waveform plots, first level: average time–domain ERP activity by feedback and group, frequency-filtered (third order Butterworth) to illustrate activity in the theta (3–9 Hz bandpass) range corresponding to FRN response (FCz, left plot) and activity in the delta (3 Hz lowpass) range corresponding to P3 response (Cz, right plot). b Color surface plots, second level: time–frequency representation of the theta-FRN and delta-P3 principal component scores following feedback onset on loss and gain trials combined (depicted for the placebo vs. alcohol difference). Topographical maps, third level: scalp topography distributions for the mean of the TF-PCA energy for the theta-FRN (left map) and delta-P3 (right map). From the topographical maps, it can be seen that the theta-FRN activity is maximal frontocentrally (at FCz) and enhanced for loss versus gain trials (upper left topomap of Fig. 1b), consistent with the interpretation that this component is a measure of “FRN.” Similarly, the more central topographical distribution of delta-P3 matches that of the time–domain P3. Note that the loss–gain difference for theta-FRN is opposite to that of the negative-going time–domain FRN, since TF measures are scaled such that more amplitude is most positive. Further, delta-P3 is enhanced for gain versus loss trials (upper right topomap of b). The middle row of topographical maps illustrates the scalp distribution of the group difference for both theta-FRN and delta-P3. Further, the bottom row of topographical maps highlights the feedback × group interaction for theta-FRN, due to a larger alcohol-related amplitude reduction following loss versus gain trials. PC principal component

