Figure 1.
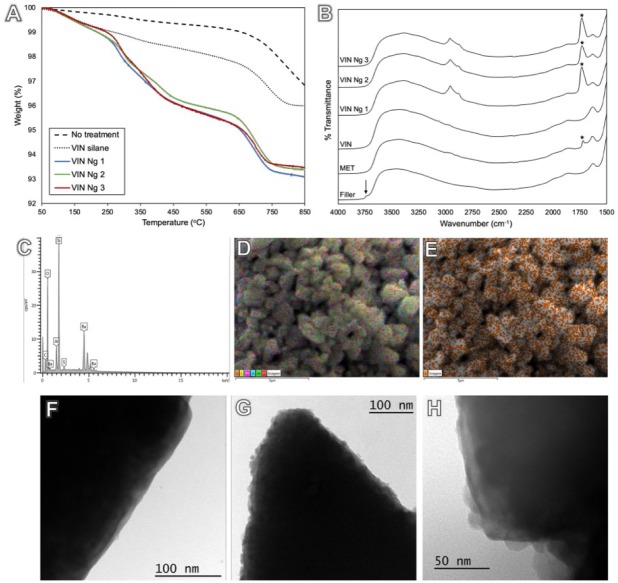
Thermogravimetric analysis displays filler surface coverage with silane (1 wt%) in relation to the nontreated filler and added nanogels (3 ± 1 wt%). (A) The major weight loss associated with nanogel treatment starts around 250 ºC, which, with the mass loss, confirms that nanogels are reacted to the surface. Diffuse reflectance spectroscopy shows free silanol groups (3,742 cm–1; arrow) for untreated glass fillers, which were consumed after silanization. Methacrylate carbonyl peak at 1,706 cm–1 (asterisk) is present for γ-methacryloxypropyltrimethoxysilane and in a higher intensity for nanogel treatments. (B) Multiple aliphatic peaks (2,856 to 2,962 cm–1) can also be observed for nanogel treatments. (C, D) Energy-dispersive x-ray spectrometry analysis identified C, O, Al, Si, and Ba in silanated fillers composition. (E) Elemental mapping demonstrates uniform distribution of S on the filler surface, correspondent to thiol-functional groups on the surface-bound nanogels. The filler surface can be observed in a transmission electron microscopy image with no treatment (300,000×, F) and with nanogel attachment found both isolated and in agglomerates (300,000×, G), with size compatible to gel permeation chromatography characterization (VIN Ng 2 at 500,000×, H). Ng, nanogel; VIN, trimethoxyvinylsilane.

