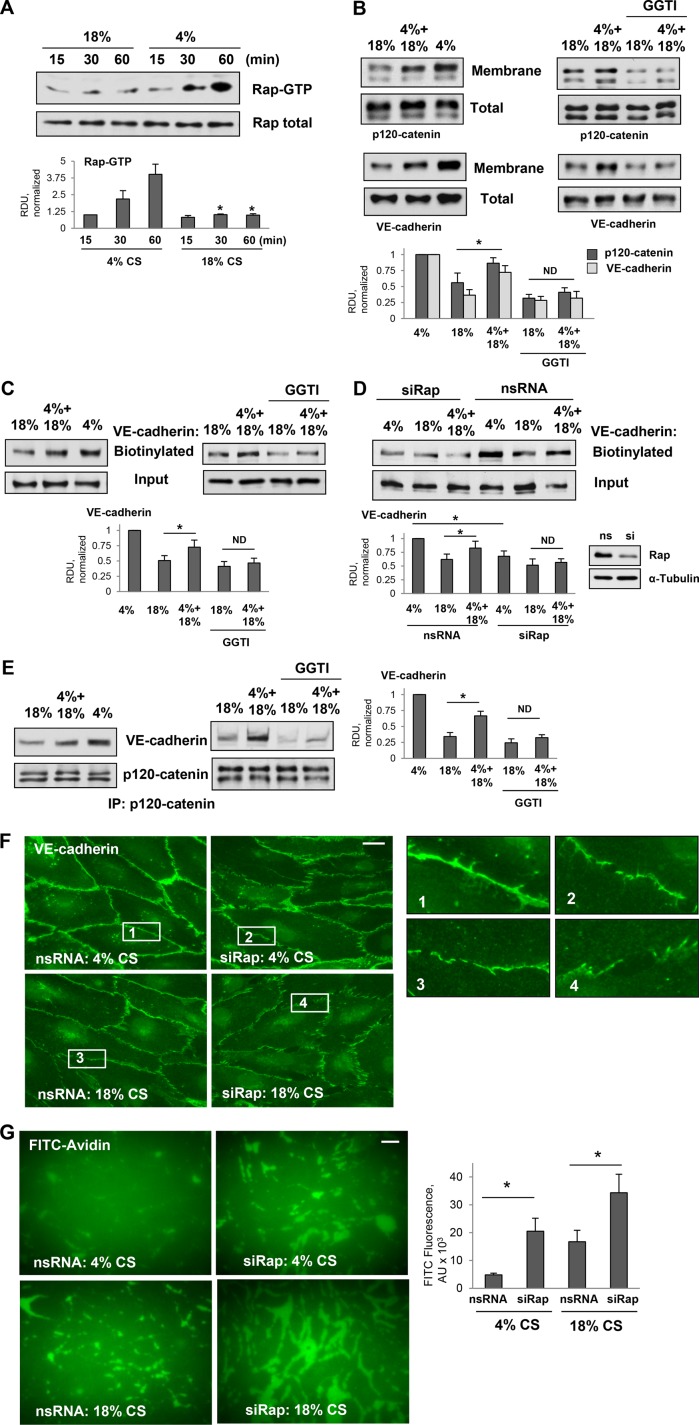
FIGURE 3:
Effects of pulmonary EC exposure to different CS patterns on Rap1 activation and association between VE-cadherin and p120-catenin. (A) Time course of Rap1 activation in pulmonary ECs exposed to 18% CS or 4% CS. Pull down of GTP-bound Rap1 reflecting Rap1 activation levels was performed as described in Materials and Methods. Rap1 content in total cell lysates was used as a normalization control. Bar graphs represent analysis of Western blot data; n = 4; *, p < 0.05 vs. 4% CS. (B) Western blot analysis of p120-catenin and VE-cadherin content in the membrane/cytoskeletal fractions of EC exposed to 6-h 18% CS, 3-h 4% CS switched to 3-h 18% CS, or 6-h 4% CS. The content of p120-catenin and VE-cadherin in the total cell lysates was used as a normalization control. Bar graphs represent analysis of Western blot data; n = 5; *, p < 0.05. (C) HPAECs were exposed to 6-h 18% CS or 3-h 4% CS switched to 3-h 18% CS with or without pretreatment with GGTI-298 (15 µm, 30 min) before CS stimulation, and surface protein biotinylation assay was performed for VE-cadherin. VE-cadherin content in total cell lysate is presented as input. Bar graphs represent analysis of Western blot data; n = 3; *, p < 0.05. (D) HPAECs treated with nonspecific or Rap1-specific siRNA 48 h before CS stimulation were exposed to 6-h 18% CS or 3-h 4% CS switched to 3-h 18% CS. Surface protein biotinylation assay was performed for VE-cadherin. Inset demonstrates efficiency of siRNA-induced Rap1 protein depletion. Bar graphs represent analysis of Western blot data; n = 3; *, p < 0.05. (E) Coimmunoprecipitation of VE-cadherin and p120-catenin from cell lysates of ECs exposed to 6-h 18%CS, 3-h 4% CS switched to 3-h 18% CS, or 6-h 4% CS (left panel) or ECs pretreated with GGTI-298 before CS stimulation (right panel). Antibody to p120-catenin was used for immunoprecipitation. Membrane reprobing for p120-catenin was used as a normalization control. Inset shows Western blot analysis of siRNA-induced Rap1 depletion. Bar graph depicts quantitative analysis of immunoprecipitated protein complexes; n = 4; *, p < 0.05. (F) Rap1 knockdown attenuates VE-cadherin immunofluorescence at cell junctions of ECs exposed to 4% CS and promotes further disruption of VE-cadherin positive cell contacts in ECs exposed to 18%CS. Bar = 5 µm. Insets depict higher magnification images of cell junction areas. (G) Rap1 knockdown increases accumulation of FITC-avidin tracer on the substrate underlying EC monolayers. Bar = 10 µm. Bar graphs depict quantitative analysis of FITC signal expressed as mean ± SD of four independent experiments, five fields per condition; *, p < 0.05.

