FIGURE 2:
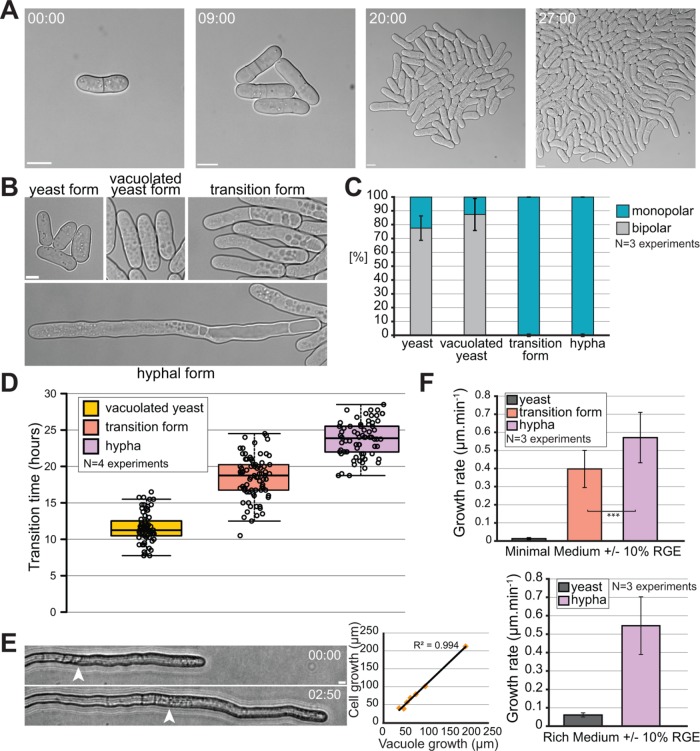
Kinetics of the morphological yeast-to-hypha transition. (A) DIC microscopy images of minicolony formation in a microfluidics chamber. (B) DIC microscopy images of the four identified morphological states of S. japonicus during the yeast-to-hypha transition in a microfluidic chamber. (C) Quantification of monopolar and bipolar cells in the four morphological states of S. japonicus (n = 51 hyphae and >100 cells for the other states). Yeast cells were quantified without RGE, the other forms 8–30 h after RGE addition. (D) Quantification showing time at which each morphological state first appeared after induction with RGE in microfluidic chambers (n > 70 cells per state). Box plot shows first and third quartile and median; whiskers extend 1.5 times the interquartile range from the first and third quartiles. (E) Bright-field microscopy images showing a growing hypha on solid medium (edge of vacuole shown with arrowhead) and quantification showing a correlation between the growth of the vacuole over time and the growth of an entire hypha over the same amount of time. N = 7 hyphae over five separate experiments. R2 = 0.994, linear regression. (F) Quantification of the growth rates of different morphological forms on minimum and rich media (in minimal medium, n = 60 yeasts and >30 cells for the other states; in rich medium, n = 60 yeasts and 17 hyphae). Error bars show standard deviations. Time in h:min. Scale bars: 5 µm.

