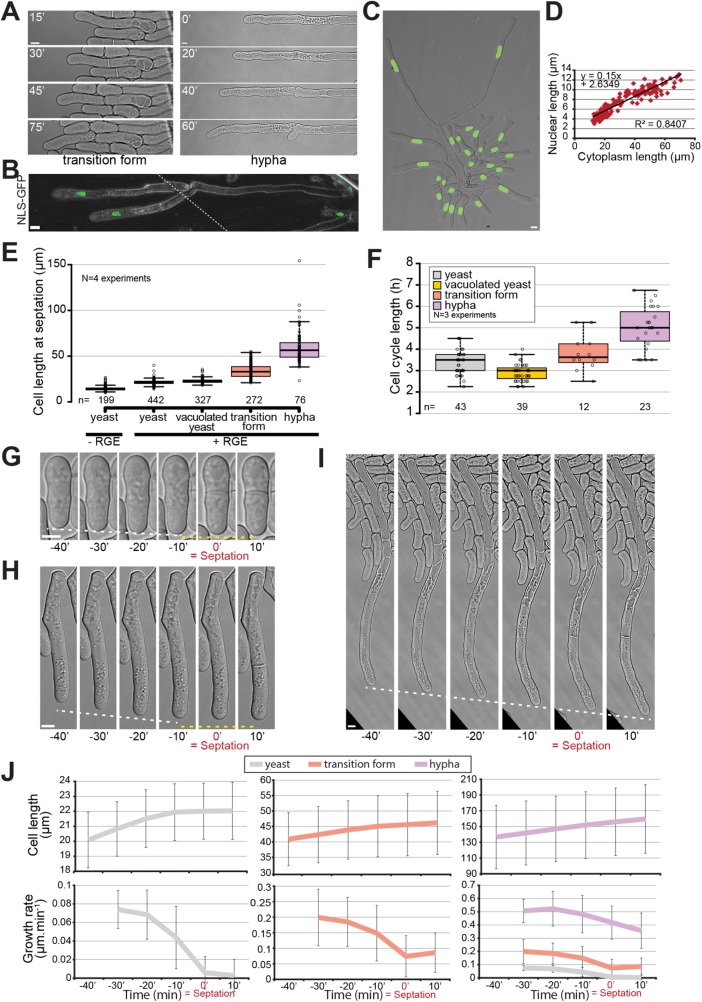
FIGURE 6:
S. japonicus produces mononuclear hyphae. (A) DIC images of transition and hyphal forms showing completion of septation. (B) Tiled confocal microscopy image of hyphae expressing NLS-GFP growing on gelatin plates. Dotted line shows the location of the tiling. (C) Strain expressing NLS-GFP growing under inducing conditions in a microfluidics plate. (D) Correlation between nuclear length and cytoplasm length (n = 178 cells). (E) Quantification of cell length at septation in the different morphological forms of S. japonicus. (F) Quantification of cell cycle length in the different morphological forms of S. japonicus. (G–I) DIC images of cell growth in microfluidic plates up to the septation event. White dotted lines show tip growth. Yellow dotted lines show absence of or reduced growth. (J) Analysis of cell length and growth rate over time aligned on septation time for yeast (gray), transition (orange), and hyphal (purple) forms (n > 18 cells per cell type). Box plots show first and third quartile and median; whiskers extend 1.5 times the interquartile range from the first and third quartiles. In J, error bars show standard deviations. Scale bars: 5 µm.

