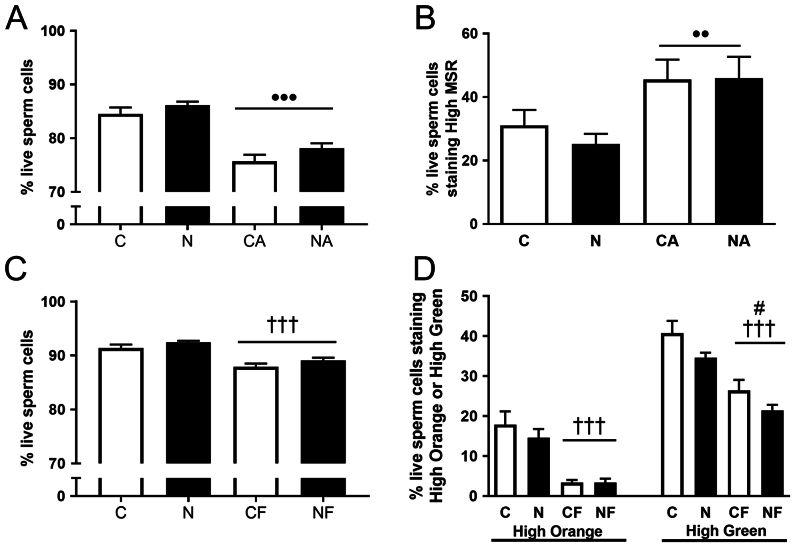
Figure 3.
Viability, oxidative stress and mitochondrial membrane potential of sperm from control and NMN-treated mice in the Oral Administration Cohort. (A) Viability as determined by 7-AAD staining of sperm used for oxidative stress measurement. •• P ≤ 0.01 reduction in viability due to positive control AA. (B) Oxidative stress as determined by mitosox red (MSR) staining. ••• P ≤ 0.001 increase in oxidative stress due to positive control arachidonic acid (AA). (C) Viability as determined by 7-AAD staining of sperm used for mitochondrial membrane potential measurement. ††† P ≤ 0.001 reduction in viability due to positive control FCCP. (D) Mitochondrial membrane potential as determined by JC-1 staining. ††† P ≤ 0.001 reduction in HO and high green-staining sperm due to positive control FCCP. # P ≤ 0.05 reduction in high green-staining sperm due to NMN. C, Control mouse sperm; N, NMN mouse sperm; CA, control mouse sperm treated with AA; NA, NMN mouse sperm treated with AA; CF, control mouse sperm treated with FCCP; NF, NMN mouse sperm treated with FCCP. Data are shown as mean ± s.e.m., n = 10–13 per group. Black bars are NMN-treated groups. Data were analysed using two-way ANOVA. Note Fig. 3A and B are measurements from the same sperm aliquot. Figure 3C and D are measurements of a different sperm aliquot, but from the same mice as for Fig. 3A and B. Data are mean ± s.e.m.

 This work is licensed under a