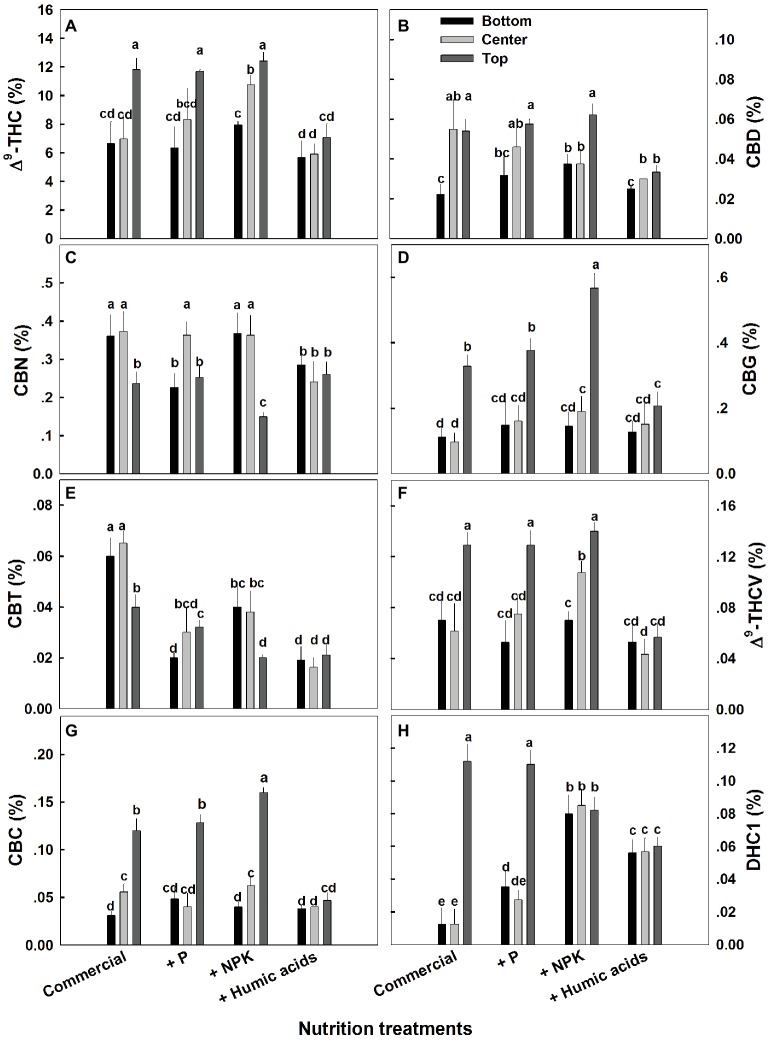
Figure 4.
Effect of nutrition supplements on spatial distribution of cannabinoids in the flowers along the cannabis plants. Δ9-THC (A), CBD (B), CBN (C), CBG (D), CBC (E), Δ9-THCV (F), CBT (G), CBL (H). Inflorescences from the top, center, and bottom of the plant were analyzed. Presented data are averages ± SE (n = 6). Different letters above the bars represent significant differences between treatments by Tukey’s HSD test at α = 0.05.

