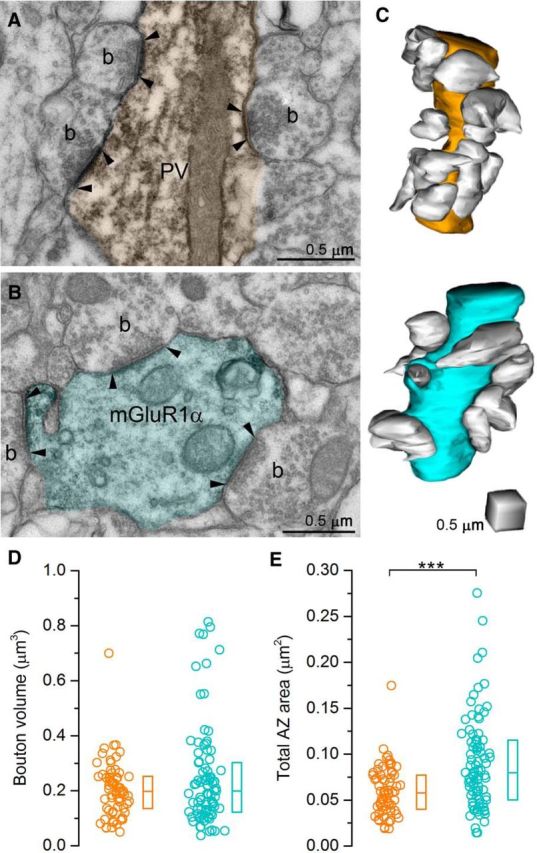
Figure 3.

3D reconstructions of PC axon terminals targeting PV+ or mGluR1α+ dendrites. A, B, Electron micrograph of a PV+ (orange, A) and an mGluR1α+ (cyan, B) dendrite (labeled with preembedding peroxidase reaction, dark precipitate) receiving several excitatory inputs from presynaptic boutons (b). Arrowheads indicate the postsynaptic densities. C, Representative dendritic segments are reconstructed in 3D. Boutons are white and postsynaptic dendrites are orange (PV+) or cyan (mGluR1α+). D, E, Bouton volume is not (p = 0.65 MW U test, D), but the total active zone area is significantly (p = 0.0001 MW U test, E) different between PV+ and mGluR1α+ dendrite-targeting terminals. Circles indicate individual boutons, boxes indicate IQRs, and horizontal bars indicate medians.
