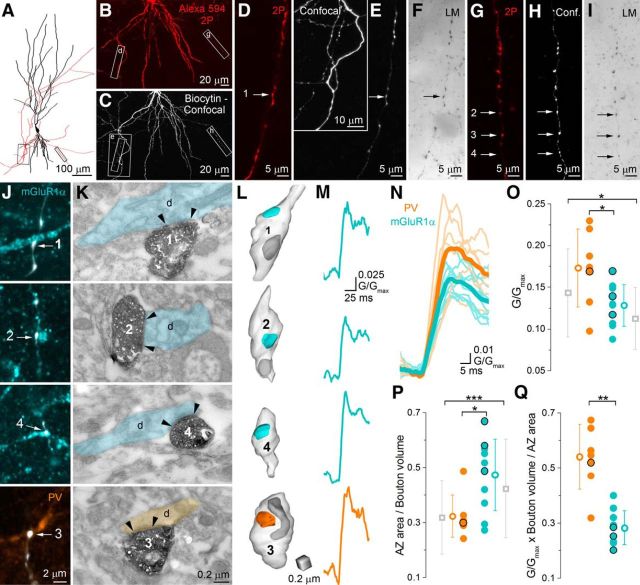
Figure 4.
Combined functional and morphological analyses of individual boutons show differences in the amount of Ca2+ in PC axon terminals innervating PV+ or mGluR1α+ INs. A, Neurolucida reconstruction of a CA3 PC filled with 20 μm Alexa Fluor 594, 300 μm Fluo5F, and biocytin. B, Low-magnification 2P microscopic image stack of the basal dendritic tree and the axonal arbor of the cell. C, Low-magnification confocal image stack of the same cell. Boxed areas in A–C indicate the axon collaterals where 21 boutons were imaged. D–I, High-magnification views of the two imaged axon collaterals (2P images: D and G; corresponding confocal images: E and H; corresponding transmission light microscopy images: F and I). Inset in E shows the same axonal arbor at a lower magnification. Arrows indicate those boutons that contacted either mGluR1α (#1, #2, and #4) or PV (#3) immunopositive dendrites. J, Immunofluorescent labeling for mGluR1α (cyan), PV (orange), and biocytin (white) of the imaged area. Arrows point to boutons that form putative synapses on the labeled dendrites. K, Correlated electron micrographs of the boutons shown in J. Arrowheads indicate the edges of the morphologically identified postsynaptic densities. L, 3D reconstructions of the boutons shown in J and K. Light blue indicates the active zone; dark gray indicates mitochondria. M, Individual [Ca2+] transients (average of two scans) recorded in the same boutons. N, O, Calcium transients in boutons with EM reconstructed AZs (N: individual transients: semitransparent, mean: bold; PV: orange, n = 7, mGluR1α: cyan, n = 10). The peak amplitude of the [Ca2+] transients is 1.3 times larger in PV-targeting (orange) compared with mGluR1α-targeting (cyan) boutons (p = 0.045 MW U test, black circles correspond to data points obtained from the cell shown in A–M). Gray symbols indicate average [Ca2+] transients of the two bouton populations that were verified with confocal microscopy only (data from Fig. 2I). P, Active zone area normalized to the bouton volume was significantly (p = 0.04 MW U test) larger in mGluR1α+ (n = 10) than in PV+ (n = 7) dendrite-targeting boutons similar to the population averages (gray symbols, p < 0.0001 MW U test). Q, Calculated total Ca2+ per AZ area is twice as large in PV+ (n = 7) as in mGluR1α+ (n = 10) dendrite-targeting boutons (p = 0.002, MW U test). Data are presented as mean ± SD.

