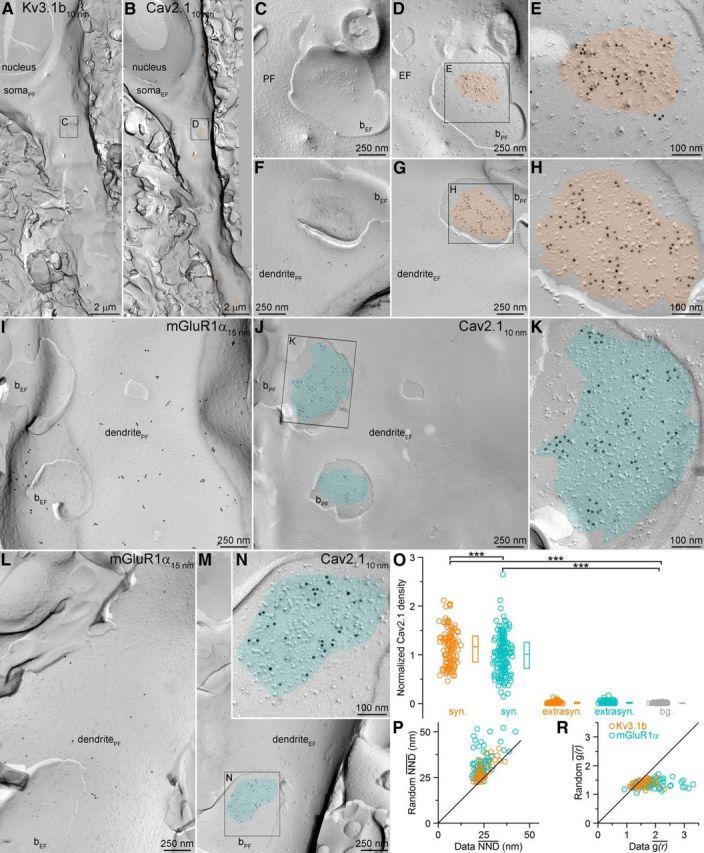
Figure 5.

The density of Cav2.1 subunits is 1.15 times larger in the AZs of Kv3.1b+ compared with mGluR1α+ dendrite-targeting boutons. A, B, Corresponding EM protoplasmic-face (PF) and exoplasmic-face (EF) images of a Kv3.1b+ (expressed in PV+ cells) cells receiving several excitatory inputs (orange in B). C, D, Higher-magnification images of the boxed areas in A and B show a perisomatic EF membrane with attached PF fragments of axon terminals (bPF) containing AZs (orange in D). Active zones are indicated by the loose cluster of intramembrane particles. E, Higher-magnification view of the boxed areas in D. F–H, Another example of an intensely Cav2.1 labeled AZ attached to a Kv3.1b+ dendrite. I, J, PF and EF images of an mGluR1α-immunoreactive dendrite contacted by axon terminals with AZs (cyan in J). K, Higher-magnification image of the boxed area in J. L–N, Another mGluR1α+ dendrite-attached AZ with intense Cav2.1 labeling. O, Normalized densities of gold particles labeling the Cav2.1 subunit within presynaptic AZ (syn.), extrasynaptic bouton membranes (extrasyn.), and surrounding EF membranes (background: bg., gray) obtained from five rats. Post hoc MW U tests with Bonferroni correction after Kruskal–Wallis test (p < 0.0001) demonstrated a significant difference between the synaptic and background labeling (p < 0.0001) and between the synaptic compartments of Kv3.1b+ and mGluR1α+ dendrite-targeting boutons (p < 0.001). Circles indicate individual measurements of AZs, boxes indicate IQRs, and horizontal bars indicate medians. P, NND was calculated for each gold particle within an AZ and the mean value (NND) is plotted against the NND of randomly placed gold particles (repeated 1000 times) for each AZ contacting Kv3.1b+ (n = 43) or mGluR1α+ (n = 72) dendrites. Wilcoxon signed-rank test revealed a significant difference (p < 0.0001) between the data and the random distributions for both AZ populations. R, Comparison of the mean two dimensional spatial autocorrelation functions (g(r)) measured in individual Kv3.1b+ (n = 43) or mGluR1α+ (n = 72) dendrite-targeting AZs to their simulated random controls (repeated 1000 times). Wilcoxon signed-rank test revealed significant differences (p < 0.0001) between the data and the random distributions for both AZ populations.
