
Figure 2.
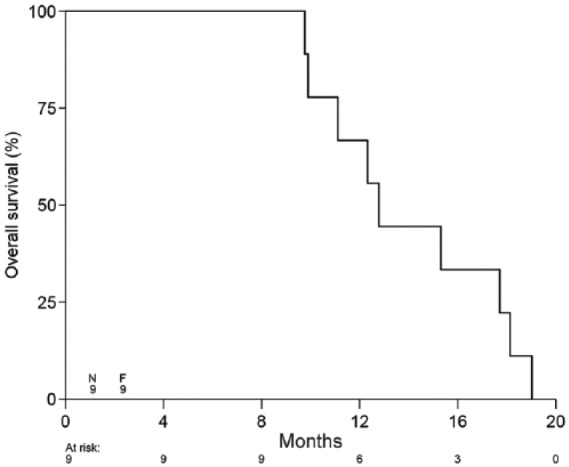
Kaplan–Meier plot of overall survival stratified by time interval between diagnosis and death.
n represents the number of patients at the start of the study; F represents the number of failures.
Nine patients were included into phase A of the study: at 4 months and 8 months after diagnosis, nine had survived; at 12 months after diagnosis, six had survived; at 16 months after diagnosis three had survived; and at 20 months, all had died.