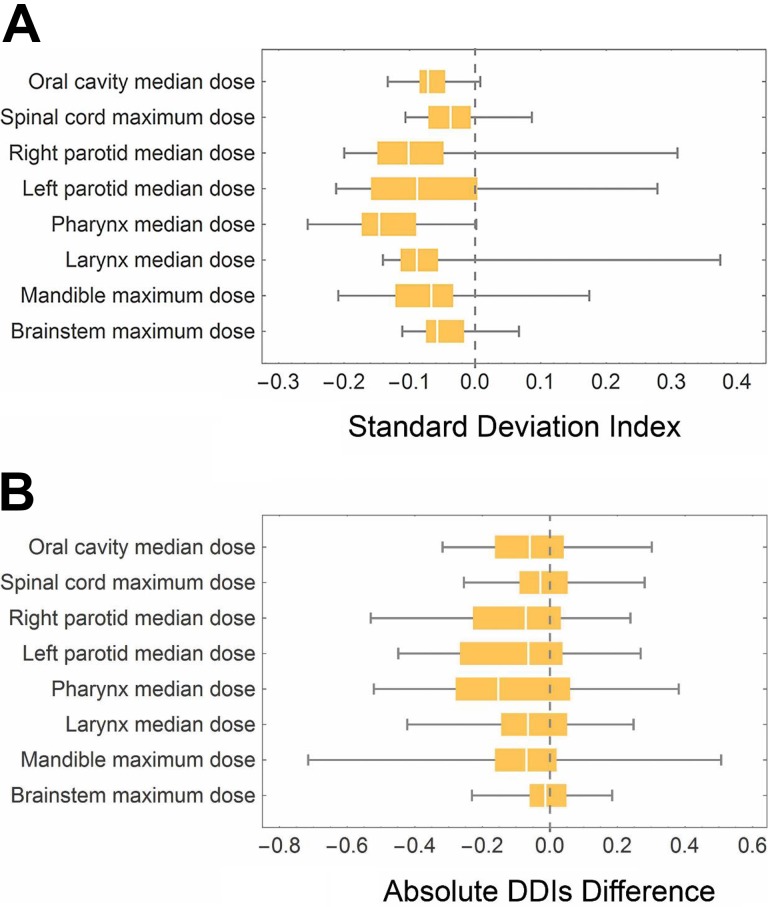
Figure 3.
Distribution of standard deviation difference of dosimetric results and absolute dose deviation index (DDI) difference of randomly selected target treatment plans for validation. A, Box and whisker plot of dosimetric result standard deviation difference with and without similar plan selection. Each OAR with the corresponding dosimetric result is labeled on the left side. The central band is the median. The left and right edge of each box represent 25% and 75% quantile, respectively. The ends of the whiskers are the minimum and maximum of the data. All the 75% quantiles of the standard deviation difference are smaller or very close to 0. B, Box and whisker plot of absolute DDI differences with and without similar plan selection. Similarly, the central band is the median value and the box edges are 25% and 75% quantiles. The edges of whickers are minimum and maximum value of absolute dose deviation index (DDI) differences.

