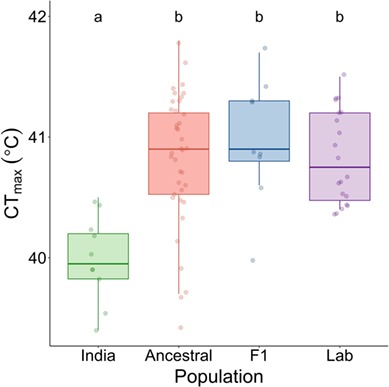
Figure 4.

The effect of laboratory acclimation and short- and long-term domestication on thermal tolerance (CTmax) in zebrafish. Comparison between wild fish tested on-site in India (India, site number 8, n = 10), laboratory-acclimated (1 month) wild fish (Ancestral, n = 38), the F1 generation of the wild fish (F1, n = 10) and the domesticated AB-WT laboratory-strain zebrafish (Lab, n = 20). Letters (a and b) indicate significant differences between populations. Raw data are shown as datapoints overlayed on the boxplots. All fish had been acclimated to, or had a site temperature of, 28°C prior to the CTmax test. The boxplots show first and third quartiles (boxes), the median (line in box) and the minimum and maximum values (whiskers, excluding outliers).
