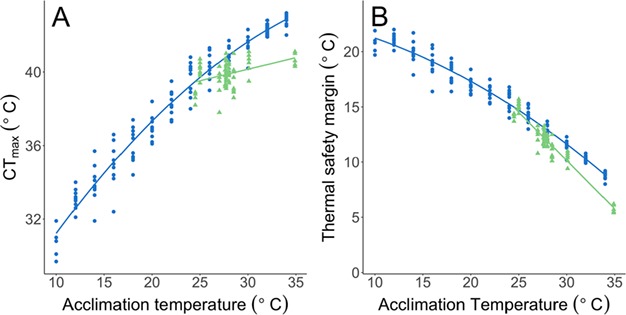
Figure 5.

The relationship between site/acclimation temperature and (A) thermal tolerance (CTmax) and (B) thermal safety margin (difference between acclimated temperature and thermal tolerance) of wild-caught zebrafish tested on-site in India (i.e. adapted to naturally varying field conditions) (n = 4–10 per site, green line and triangles) and fish acclimated to a temperature range under controlled laboratory settings after short-term domestication (F1 generation, n = 5–10 per acclimation temperature: blue line and circles).
