
Fig 1.
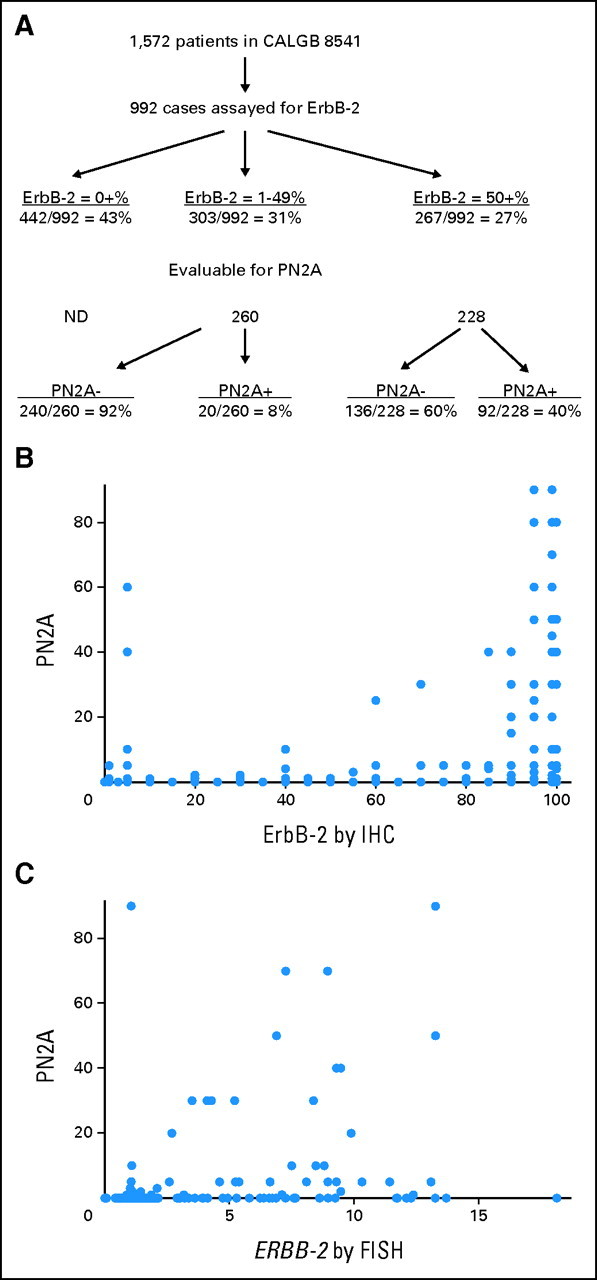
(A): Flow diagram showing distribution of patients by ErbB-2 status. Scattergrams of the relationship of phospho-ErbB-2 (PN2A) score to (B) ErbB-2 immunohistochemical score and (C) to ERBB-2 gene amplification ratio by fluorescence in situ hybridization. Of note, each dot may represent more than one case (particularly for points along the x-axis). ND, not done.